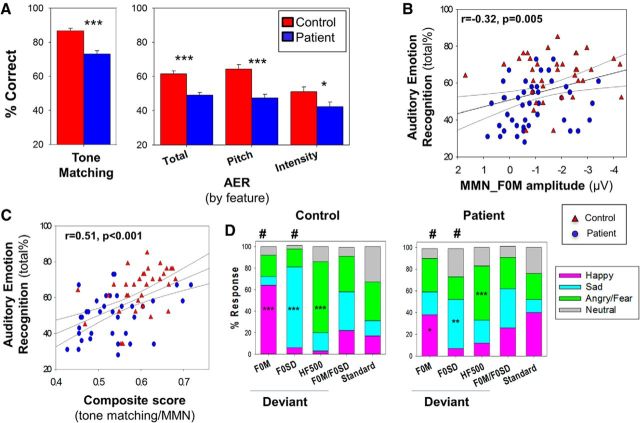
Figure 5.
A, Bar graph (mean ± SEM) of percentage correct for auditory and emotion processing tasks. AER: total, pitch, and intensity scores. y-axis is calibrated to start from chance performance. ***p < 0.001 (independent-samples t test). *p < 0.05 (independent-samples t test). B, Scatter plot of total score for performance on auditory emotion recognition versus surface MMN_F0M. C, Scatter plot of total score for performance on auditory emotion recognition versus composite of tone-matching task and surface MMN_F0M. D, Stacked bar graphs noting percentage answered for listed deviants on FM-prosody task. Blue represents patients; red represents controls. ***p < 0.001 (one-sample t tests for hypothesized emotion). **p < 0.01 (one-sample t tests for hypothesized emotion). *p < 0.05 (one-sample t tests for hypothesized emotion). #p < 0.05 (between-group independent-sample t test for most prevalent emotion). F0M, Happy; F0SD, sad.

