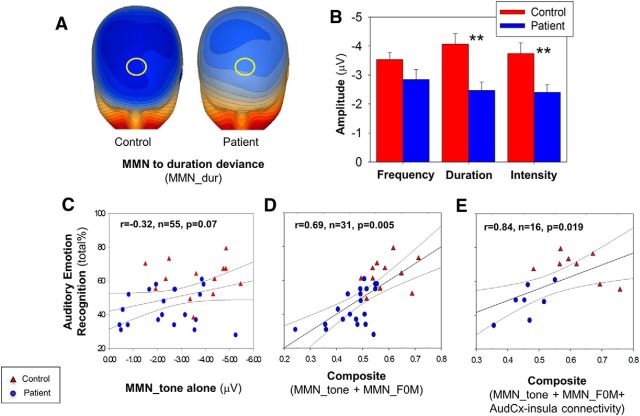
Figure 7.
A, Voltage topography maps for MMN to duration deviant (174 ms, 16 μV/step) for available patients (n = 30) and controls (n = 25). Yellow circle represents location of analyzed electrodes. B, Bar graph (mean ± SEM) of peak amplitude for simple tone deviants. C, Scatter plot of total score for performance on auditory emotion recognition versus mean amplitude across the three tested features. D, Scatter plot of total score for performance on auditory emotion recognition versus composite of surface MMN_F0M and MMN to simple tone deviants. D, Scatter plot of total score for performance on auditory emotion recognition versus composite of surface MMN_F0M and MMN to simple tone deviants. E, Scatter plot of total score for performance on auditory emotion recognition versus composite of surface MMN_F0M, pairwise functional connectivity between insula, and auditory cortex and MMN to simple tone deviants. Blue represents patients; red represents controls. **p < 0.01. AudCx, Auditory Cortex.

