
Figure 1.
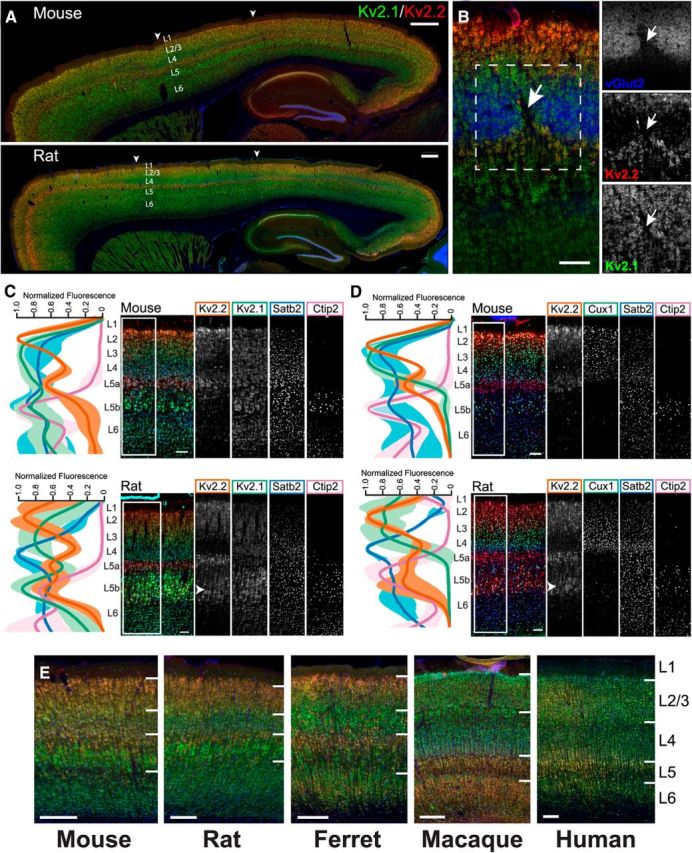
Kv2.1 and Kv2.2 exhibit specific and unique expression patterns in mammalian cortex. A, Mouse and rat sagittal brain sections immunolabeled for Kv2.1 (green) and Kv2.2 (red), with Hoechst (blue) to label nuclei. Arrowheads denote S1, in which L4 is relatively devoid of Kv2.2 immunoreactivity. Scale bars, 500 μm. B, Mouse coronal section of S1 barrel cortex immunolabeled for Kv2.1 (green), Kv2.2 (red), and vGlut2 (blue). Arrow denotes septum between barrels. Scale bar, 100 μm. C, Mouse and rat sagittal sections from S1 immunolabeled for Kv2.1 (green), Kv2.2 (red/orange), Satb2 (L2-6, blue), and Ctip2 (L5b-6, cyan/pink). Line plots depict depth profile of average fluorescence intensity calculated for the region within the rectangle across three animals. Data were smoothed (rolling average, 25 points) and normalized to maximum intensity for each channel in MATLAB. Light, thick lines represent the SD. Note that, whereas Kv2.1 expression is relatively consistent across all cortical layers, Kv2.2 shows strongest expression in layers 2 and 5a. Arrowhead in rat section denotes additional Kv2.2 expression in cells of lower L5. Scale bars, 100 μm. D, Mouse and rat sagittal sections from S1 immunolabeled for Kv2.2 (red/orange), Cux1 (L2-4, green), Satb2 (L2-6, blue), and Ctip2 (L5b-6, cyan/pink). Line plots are constructed as in C. Arrowhead highlights the portion of rat L5b exhibiting high Kv2.2 expression. Scale bars, 100 μm. E, Sections of striate visual cortex from mouse, rat, ferret, macaque, and human immunolabeled for Kv2.1 (green) and Kv2.2 (red) and with Hoechst (blue) to label nuclei. Lines demarcate layer boundaries, which are labeled to the right. Scale bar, 200 μm.