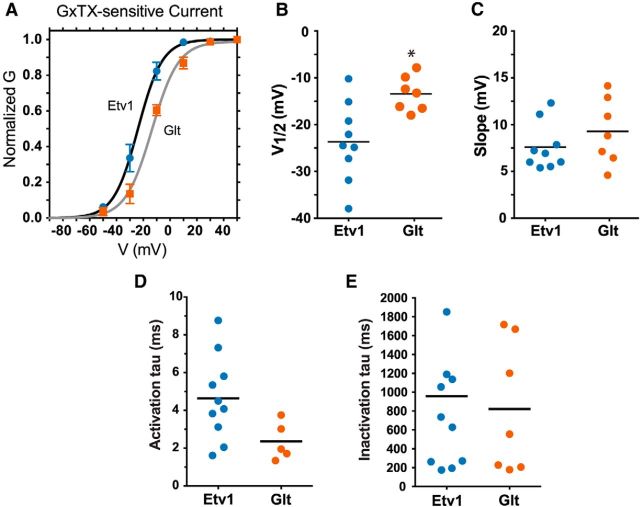
Figure 10.
Biophysical properties of GxTX-sensitive current from Etv1 and Glt cells of L5. A, Average normalized steady-state activation curves for somatic outside-out macropatch recordings of GxTX-sensitive current from Etv1 (n = 9) and Glt cells (n = 7). For Etv1, the V1/2 was significantly more negative (−23.7 ± 2.7 mV) than for Glt cells (−13.4 ± 1.3 mV) by unpaired t test. B, Scatter plot of V1/2 for the individual cells contributing to activation curves in A. Horizontal line represents the mean. *Significant difference from Etv1 (p < 0.01). C, Scatter plot for Boltzmann slope for individual cells contributing to activation curves in A. The horizontal line represents the mean. The mean slope did not differ significantly between Etv1 and Glt cells by unpaired t test. D, Scatter plot of activation tau at 0 mV for Etv1 and Glt cells. The activation time constant was marginally significantly different (p < 0.051) between Etv1 cells (4.6 ± 0.7 ms; n = 10) and Glt cells (2.4 ± 0.4 ms; n = 5) by unpaired t test. E, Scatter plot of inactivation tau for Etv1 and Glt cells. Our 500 ms steps were not long enough for precise estimate of the slow inactivation time constants for the GxTX-sensitive current, but the estimated inactivation tau at 0 mV did not differ between Etv1 cells (957 ± 261 ms; n = 11 cells) and Glt cells (822 ± 262 ms; n = 7 cells).

