
Figure 2.
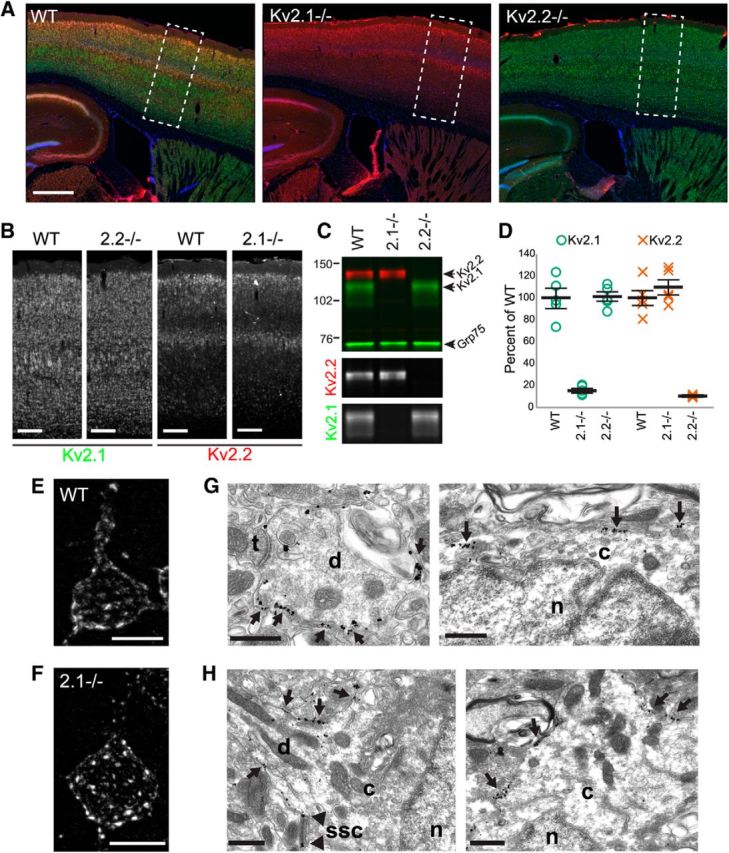
Kv2.2 expression and subcellular localization is maintained in Kv2.1 KO mice. A, WT (left), Kv2.1-KO (Kv2.1−/−, center), and Kv2.2-KO (Kv2.2−/−, right) sagittal sections immunolabeled for Kv2.1 (green) and Kv2.2 (red) and with Hoechst (blue) to label nuclei and imaged at equal exposures. Rectangles outline regions shown in B. Scale bar, 500 μm. B, Grayscale insets from images in A, again at equal exposures (2.2−/− = Kv2.2-KO; 2.1−/− = Kv2.1-KO). Note that Kv2.2 expression is maintained in L2 and L5a in the Kv2.1-KO. Scale bar, 200 μm. C, Example immunoblot of crude neocortical homogenates from WT, Kv2.1-KO (2.1−/−), and Kv2.2-KO (2.2−/−) mice probed for Kv2.1 (top green band), Kv2.2 (red) and Grp75 (bottom green band) as a loading control. Numbers on the left indicate the mobility of molecular weight standards in kilodaltons. Lower grayscale panels show the individual Kv2.2 and Kv2.1 signals extracted from the color immunoblot. D, Summary graph of differences in Kv2.1 and Kv2.2 protein levels in cortex between WT and KO mice. Fluorescence intensity values were background subtracted and normalized to the loading control (Grp75) and then expressed as percentage of total WT signal. Error bars represent the SEM and symbols represent each independent measurement (n = 5 mice per group). Differences in Kv2 expression between WT and KO samples were not statistically significant as evaluated by independent t test (Kv2.1, p = 0.89; Kv2.2, p = 0.35). E, F, High-magnification images of L5a pyramidal neurons from WT (E) and Kv2.1-KO (2.1−/−) mice (F) immunolabeled for Kv2.2. Note that, whereas Kv2.2 clusters in WT mice are plaque like, Kv2.2 clusters in the Kv2.1-KO are more punctate. Scale bars, 10 μm. G, H, Immunogold electron microscopy of Kv2.2 in WT (G) and Kv2.1-KO (H) tissue. Kv2.2 immunogold particles can be seen as discrete clusters (arrows) in the large caliber dendrite (G, left) and the somatic plasma membrane (G, right). The clustered localization of Kv2.2 is not altered in tissue obtained from Kv2.1-KO mice (H). Kv2.2 immunogold particles are seen as clusters (arrows) in the plasma membrane of the proximal dendrite and soma. Immunogold particles can also be seen in close proximity (arrowheads in H, left) to subsurface cisternae (SSC). t, Axon terminal; c, cytoplasm; d, dendrite; n, nucleus; ssc, subsurface cisternae. Scale bars, 500 nm.