
Figure 3.
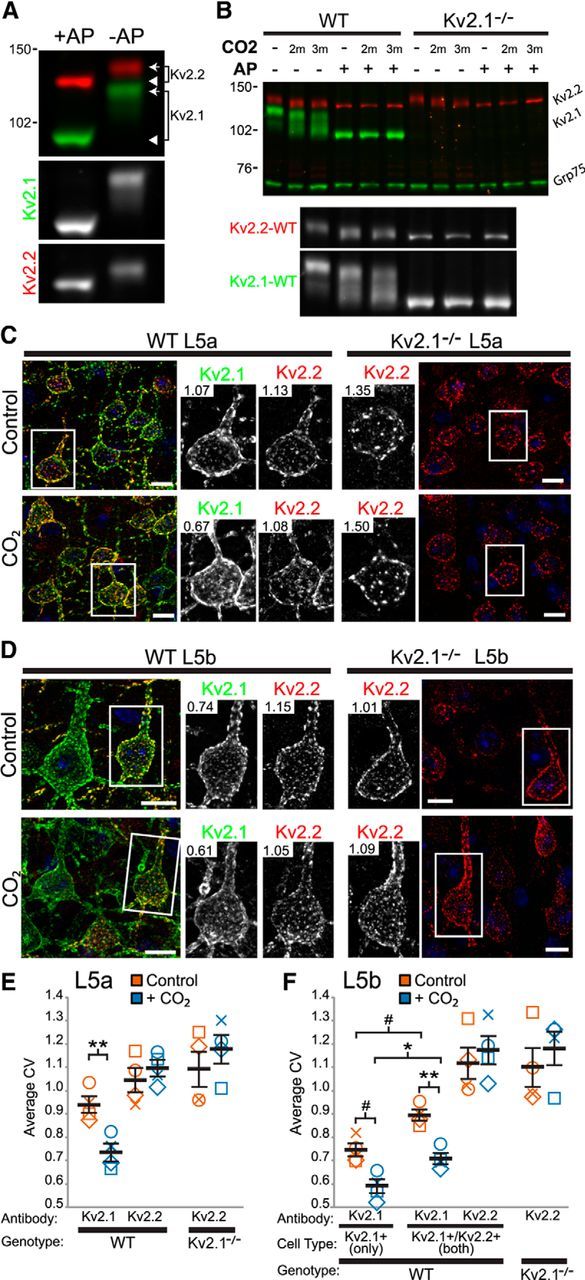
Kv2.2 exhibits a less robust response to hypoxia than Kv2.1 in situ. A, Example immunoblot of a crude WT mouse brain membrane fraction treated either with (+AP) or without (−AP) AP and probed for Kv2.1 (green) and Kv2.2 (red). Numbers on the left indicate the mobility of molecular weight standards in kilodaltons. The arrows indicate the phosphorylated form (Kv2.1 Mr ∼125 kDa; Kv2.2 Mr ∼140 kDa) and the arrowheads point to the dephosphorylated form (Kv2.1 Mr ∼95 kDa; Kv2.2 Mr ∼130 kDa). Bottom grayscale panels show the individual Kv2.1 and Kv2.2 signals extracted from the color immunoblot. B, Example immunoblot of crude whole brain homogenates prepared from brains of WT and Kv2.1-KO mice either without (control) or with CO2 treatment before killing. Samples were then incubated with AP (+AP), and proteins were analyzed by immunoblotting for Kv2.1 (green, upper band), Kv2.2 (red) and Grp75 (green, bottom band) as a loading control. Bottom grayscale panel depicts enlarged individual Kv2.2 and Kv2.1 signals from WT samples (left six lanes) of the color immunoblot. C, D, Mouse brain sections prepared from control and CO2-treated mice were double immunolabeled for Kv2.1 (green) and Kv2.2 (red) and cells in L5a (C) and L5b (D) imaged at equal exposure. Inset numbers refer to CV measurements for the depicted cell. Scale bar, 10 μm. E, Summary graph of CV measurements of L5a cells from WT and Kv2.1-KO mice that were either nontreated (control, orange symbols) or CO2 treated (blue symbols). Error bars represent the SEM and symbols represent each experiment (n = 4 mice per group). Differences in CV measurements between control and CO2 were evaluated by one-way randomized block ANOVA followed by Tukey's multiple-comparison test. Note that the y-axis origin begins at 0.5. F, Summary graph of CV measurements of L5b cells from WT and Kv2.1-KO mice. Note that L5b cells containing only Kv2.1 have significantly lower CV measurements both without and with CO2 exposure (left most orange and blue symbols). Data are represented same as in E. Note that the y-axis origin begins at 0.5. #p < 0.06; *p < 0.05; **p < 0.01.