
Figure 4.
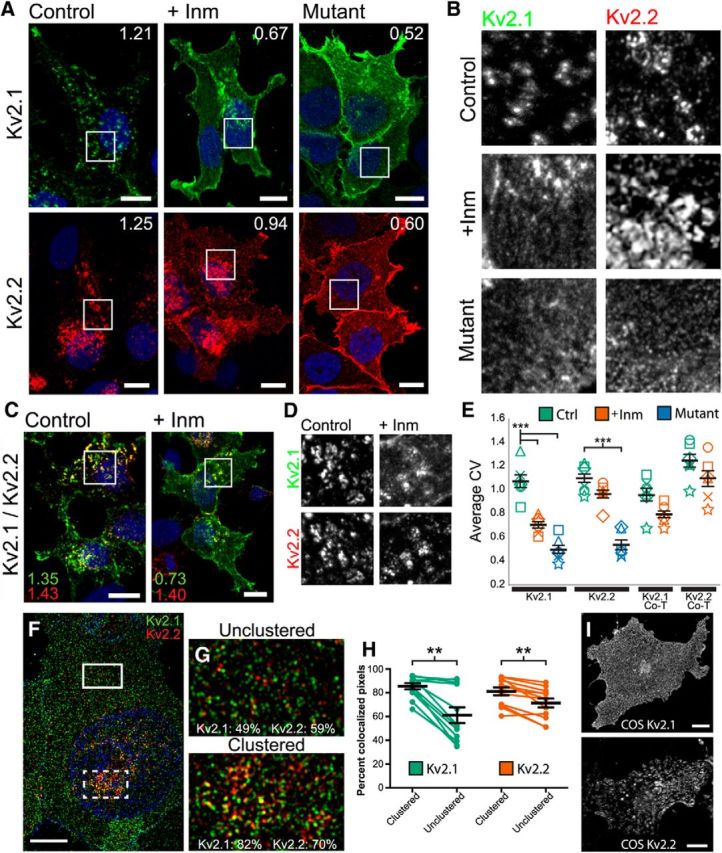
Acute regulation after Inm treatment of recombinant Kv2.2 in heterologous cells is distinct from that of Kv2.1. A, High-magnification images of HEK293T cells expressing Kv2.1 (green, top) or Kv2.2 (red, bottom) and either treated with vehicle (left) or Inm (middle) for 15 min before fixation. Right panels depict cells expressing the respective clustering mutants Kv2.1-S586A (top right) and Kv2.2-S605A (bottom right). Inset numbers refer to CV measurements of the entire cell marked by the squares. Nuclei (blue) were labeled with Hoechst. Scale bars, 10 μm. B, Grayscale insets of immunolabeling from within the squares in A. C, High-magnification images of HEK293T cells coexpressing Kv2.1 (green) and Kv2.2 (red) either treated with vehicle (control, left) or Inm (+Inm, right). Again, inset numbers refer to CV measurements of the entire cell marked by the squares. Scale bars, 10 μm. D, Grayscale insets of labeling from within the squares in C. E, Summary graph of CV measurements of transfected HEK293T cells that were either nontreated (Ctrl, green symbols) or Inm-treated (+Inm, orange symbols). Blue symbols represent CV measurements of cells expressing Kv2.1 and Kv2.2 clustering mutants. Error bars represent the SEM across all experiments and symbols represent measurements from each experiment (n = 6 replicates, 25–40 cells per group). Note that the y-axis origin begins at 0.2. Differences in CV measurements between treatments were evaluated by one-way randomized block ANOVA followed by Tukey's multiple-comparison test. ***p < 0.0001. F, High-magnification image of an HEK293T cell after Inm treatment captured with a Zeiss Elyra SIM microscope and immunolabeled for Kv2.1 (green) and Kv2.2 (red). Scale bar, 5 μm. G, Insets of unclustered region from the top box in F and clustered region from the bottom box in F. Numbers in inset refer to the MCC calculated for the entire inset, which measures the co-occurrence of two signals independent of signal proportionality. H, Summary graph of MCC values measured for Kv2.1 (green) and Kv2.2 (red) in clustered and unclustered regions of the same cell (n = 12 cells). Error bars denote mean and SEM for each group. Differences in MCC values were determined by randomized block ANOVA followed by Tukey's multiple-comparison test. **p < 0.01. I, High-magnification images of COS-1 cells expressing Kv2.1 (top) and Kv2.2 (bottom). Scale bars, 10 μm.