
Figure 5.
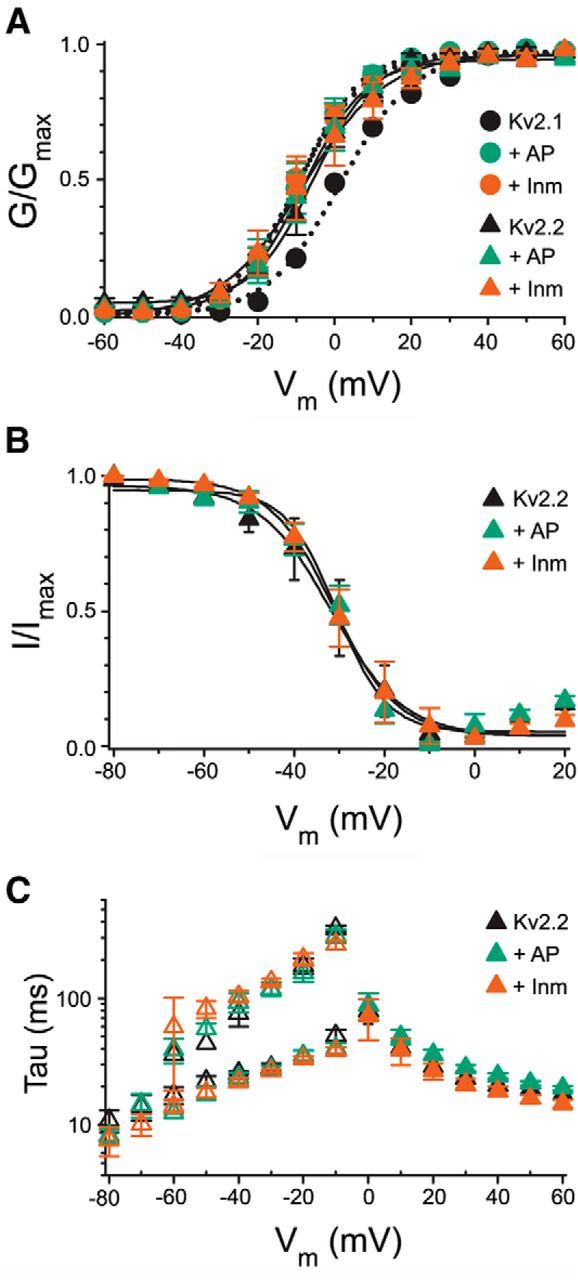
Biophysical properties of Kv2.2 before and after treatment with AP and Inm. A, Voltage dependence of activation of Kv2.2 (triangles) expressed in HEK293 cells in the absence (black) and presence of AP (green) and Inm (orange). The voltage dependence of activation was determined by plotting the normalized tail current amplitude (at −35 mV) as a function of the prepulse potential (ranging from 60 mV to −60 mV in 10 mV steps). For comparison, the voltage dependence of activation of Kv2.1 (circles) expressed in HEK293 cells before (black) and after AP (green) and Inm (orange) are also represented. Solid and dotted lines represent the Boltzmann fits. B, Voltage dependence of Kv2.2 inactivation in the absence (black) and presence of AP (green) and Inm (orange). The voltage dependence of inactivation was determined by plotting the normalized test pulse amplitude (at +60 mV) as a function of the 5 s prepulse potential (ranging from −80 to 20 mV in 10 mV increments). Solid lines represent the Boltzmann fits. C, Activation and deactivation kinetics of Kv2.2 before (black) and after AP (green) and Inm (orange). Activation kinetics (filled symbols) are obtained by a single exponential function fit to the 500 ms current traces ranging from 60 to 0 mV in 10 mV steps. Deactivation kinetics (open symbols) are derived from a double exponential function fit to the 1 s tail currents (ranging from −10 mV to −80 mV in 10 mV steps) obtained after a 250 ms prepulse to 60 mV resulting in a slow (top points) and fast (bottom points) time constant. Note that the biophysical properties of Kv2.2 are not changed upon AP or Inm treatment, whereas these treatments did affect the Kv2.1 voltage dependence of activation significantly, as demonstrated previously.