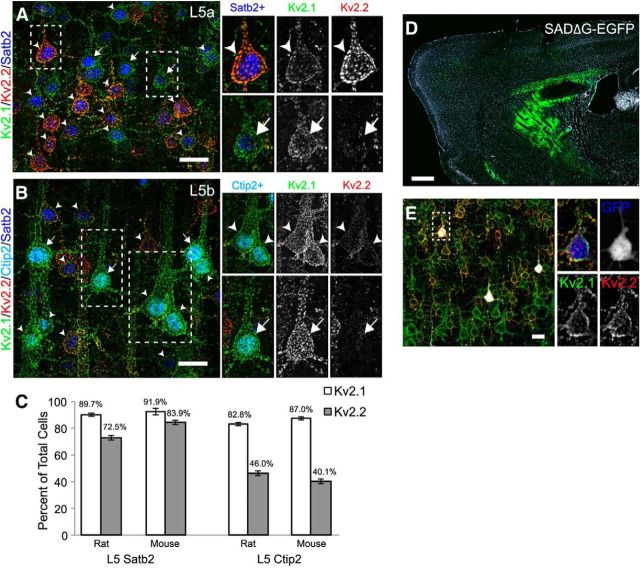
Figure 6.
Differences in Kv2 expression correspond to different cell types. A, B, Rat sagittal sections of S1 were immunolabeled for Kv2.1 (green), Kv2.2 (red), Satb2 (blue), and Ctip2 (cyan, B only). Boxed regions refer to higher-magnification images (right) of L5a (A) and L5b (B). Cells expressing Kv2.1 and Kv2.2 (arrowheads) or only Kv2.1 (arrows) are indicated. Scale bar, 20 μm. C, Cell counts of Satb2+ and Ctip2+ cells labeled for Kv2.1 and Kv2.2 in both rat and mouse. Error bars represent SEM for counts across three animals. D–E, Immunolabeling for Kv2s in retrogradely labeled striatal projection neurons. SADΔG-EGFP rabies virus was stereotaxically injected into the dorsolateral striatum of WT mice. D, Low-magnification image of a sagittal section counterstained with Hoechst 33258 (white) showing the site of injection (green). Scale bar, 500 μm. E, Low-magnification image of retrogradely labeled L5 cells ipsilateral to the injection site and immunolabeled for Kv2.1 (green) and Kv2.2 (red), with EGFP signal pseudocolored white. For the inset image, EGFP is pseudocolored blue. Scale bar, 20 μm.

