
Figure 8.
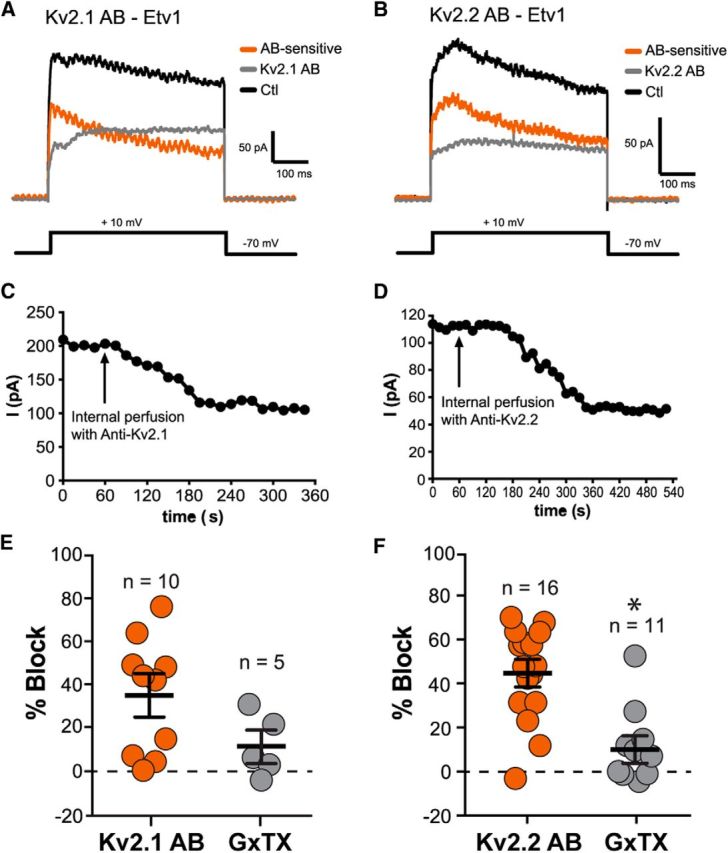
Effects of internal pipette perfusion of antibodies against Kv2.1 or Kv2.2 in patches from Etv1 cells. A, Representative traces for an outside-out patch from an Etv1 neuron (P20 mouse). Black, Control (Ctl) trace during initial baseline period; gray, trace after several minutes perfusion of the pipette and patch contents with Kv2.1 Ab (anti-Kv2.1); orange, anti-Kv2.1 sensitive current (obtained by subtraction). B, Different patch from an Etv1 cell before and after perfusion of anti-Kv2.2 (P13 mouse). The color of the traces are the same as in A. C, Plot of current (I) versus time for patch shown in A, including before and after perfusion with the Kv2.1 Ab. D, Plot of current (I) versus time for patch shown in B before and after perfusion with the Kv2.2 Ab. E, Percentage block by anti-Kv2.1 and additional block by subsequent application of 100 nm GxTX. Error bars indicate SEM. F, Percentage block by anti-Kv2.2 and additional block by subsequent application of 100 nm GxTX. Bars represent mean and ± SEM. *p = 0.0001 for the difference between Kv2.2 AB and GxTX.