Figure 9.
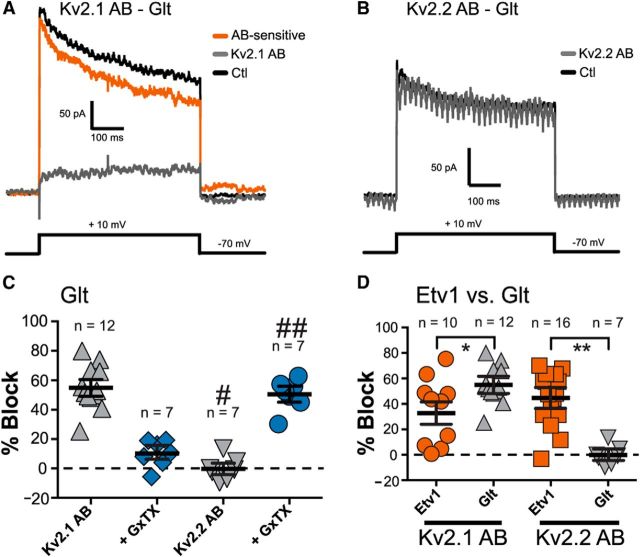
Effects of internal pipette perfusion of antibodies against Kv2.1 or Kv2.2 in patches from Glt cells. A, Representative traces for an outside-out patch from a Glt neuron (P24 mouse). Black, Control (Ctl) trace during initial baseline period; gray, trace after several minutes perfusion of the pipette and patch contents with Kv2.1 Ab (anti-Kv2.1); orange, anti-Kv2.1 sensitive current (obtained by subtraction). The Kv2.1 Ab blocks nearly all of the current. B, Different patch from a Glt cell before and after perfusion with anti-Kv2.2 (P18 mouse). There was no block by anti-Kv2.2 in this patch. C, Scatter plots showing population data for percentage block by anti-Kv2.1 and additional block by subsequent application of 100 nm GxTX. Also shown is population data for block by anti-Kv2.2 (and subsequent GxTX application). Error bars represent SEM. #Significant difference between percentage block by anti-Kv2.1 and anti-Kv2.2 (and their associated application of GxTX). #p = 0.0000001; ##p = 0.00001. D, Scatter plots of population data for percent block by anti-Kv2.1 and anti-Kv2.2 in patches from Etv1 and Glt cells. Anti-Kv2.1 blocked a significantly higher percentage of current in patches from Glt cells versus Etv1 cells. Anti-Kv2.2 blocked significantly more current in patches from Etv1 cells versus Glt cells. Error bars indicate SEM. *p = 0.035; **p = 0.00002 for the difference between Etv1 and Glt cells for the data indicated by brackets.

