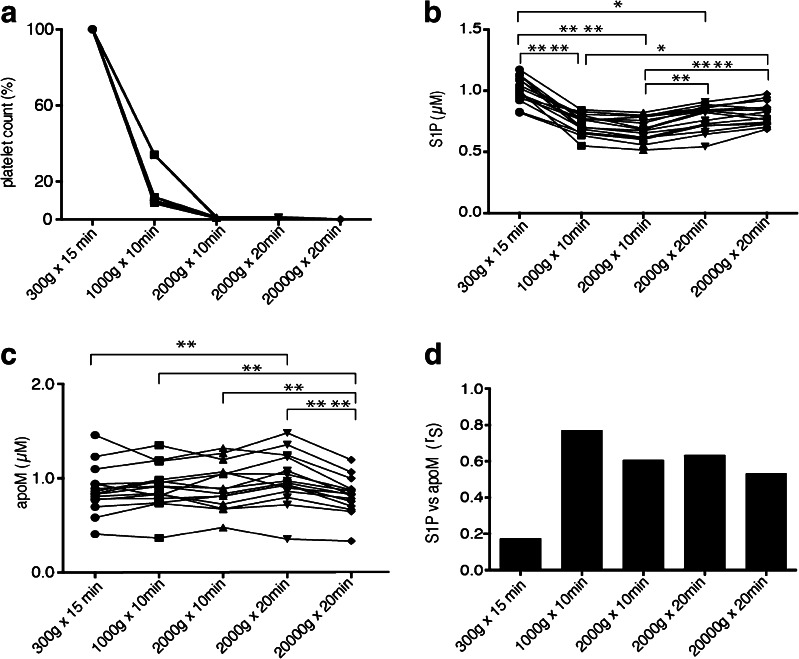
Fig. 3.
Platelet contamination affecting S1P analysis and the S1P correlation to apoM. Citrate-plasma was collected from 15 healthy individuals and centrifuged at different protocols. A Platelet concentration was measured by flow cytometry, B S1P by LC-MS/MS and C apoM by ELISA. D Correlation analysis between S1P and apoM. Results are plotted as individual values. Statistical analysis between groups was made by Friedman’s test, and correlation was calculated by Spearman’s rank correlation coefficient (r S). *p < 0.05; **p < 0.01, ****p < 0.0001

