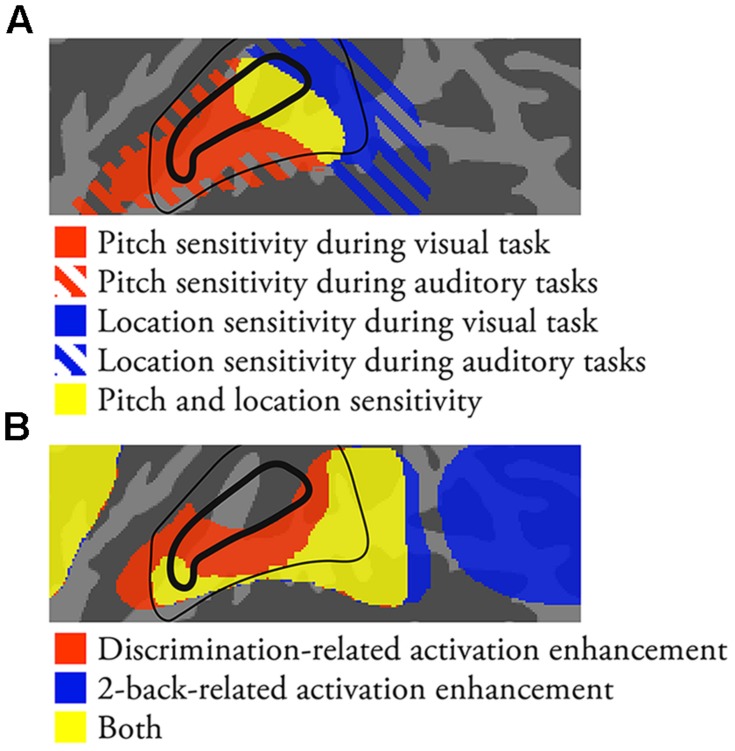
FIGURE 6.
A schematic summary of the present results together with a previously proposed model of human ACFs (Woods et al., 2010). Core and belt ACFs are enclosed by a thick and thin black line, respectively. (A) Areas showing pitch and location sensitivity. (B) Areas showing task-dependent activations.

