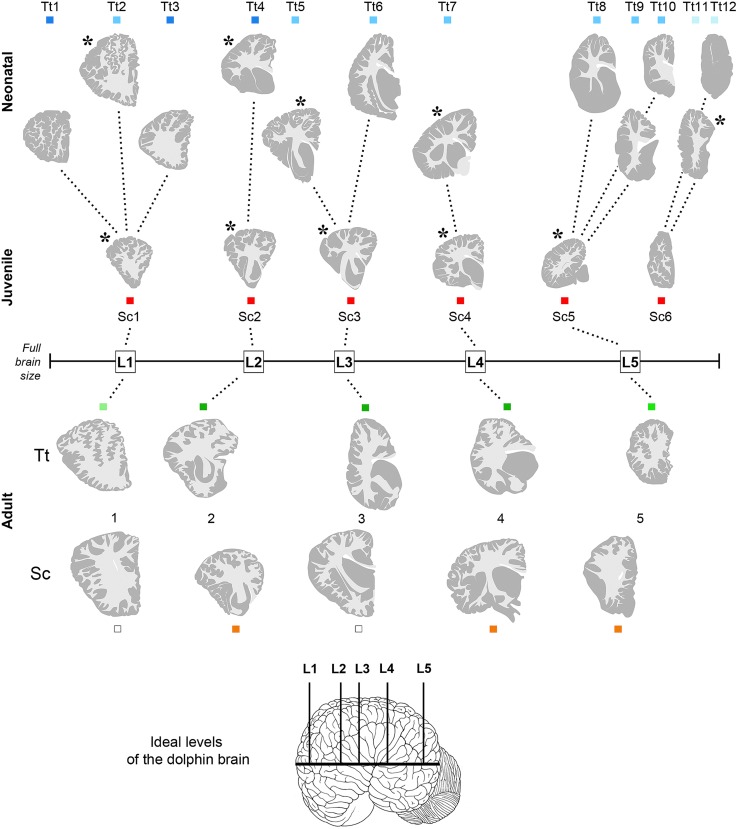
FIGURE 3.
Anterior–posterior levels obtained from drawings of coronal slices (as indicated in Figure 2) cut from brains of both species at different ages: neonatal Tt, levels Tt1–Tt12; juvenile Sc, levels Sc1–Sc6; adult Tt and Sc, levels L1–L5. Squares of different colors indicate the animal specimens whose slices have been used for drawing single levels (the same as indicated in Figure 1). Note that more numerous, although less complete brains are available for neonatal Tt, whereas only one specimen, yet with a more complete brain, is available for juvenile Sc. All the young brains were used for establishing a forebrain atlas (see Figure 7). Adult brains were used for age comparisons and white/gray matter ratio quantification. The position of each level from left to right corresponds to its exact relative location with respect to the whole brain length. Dotted lines show the best matched coronal levels from adjacent slices; L1–L5, ideal levels shared by different animals, species and ages; asterisks indicate the levels closest to ideal levels. All drawings are in scale.

