Figure 5.

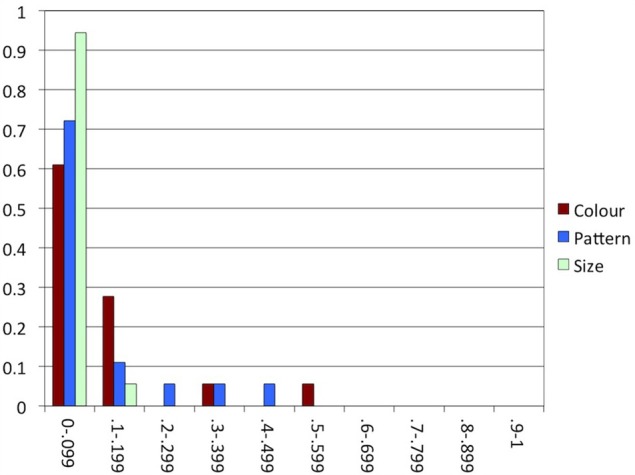
Experiment 1: The proportion of participants (y-axis) in each range of proportions of alternations in each condition (x-axis).

Experiment 1: The proportion of participants (y-axis) in each range of proportions of alternations in each condition (x-axis).