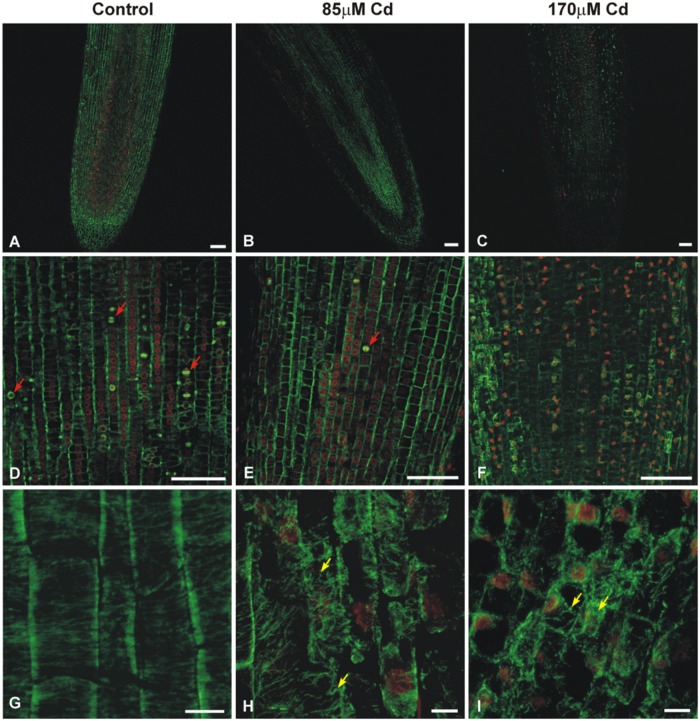
FIGURE 2.
Median longitudinal sections of soybean root apices treated with Cd indicating fluorescence signal strength, mitotic activity, and cortical MTs structure. The sections were double-labeled with anti-α-tubulin antibody (B-5-1-2) and DNA-binding dye (propidium iodide). An overview of untreated control roots (A,D,G) and the roots of seedlings treated with 85 μM (B,E,H) or 170 μM Cd (C,F,I). Exposure to Cd results in a differentiated MT immunofluorescence signal, a strong reduction in the number of proliferating cells (red arrows indicate cells in different stages of mitosis) and different stages of cortical MTs structure disorders in cells of cortex tissue (yellow arrows). Bar = 100 μm (A–F), 10 μm (G–I).

