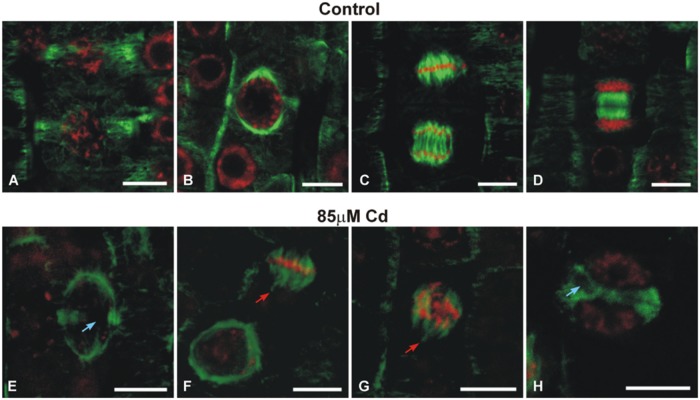
FIGURE 3.
Images showing the effects of moderate Cd (85 μM) treatment on the mitotic MT arrays of soybean root apical cells. Merged images of immunofluorescence-labeled MTs and propidium iodide-stained nuclei. Cells of control roots displaying preprophase band (A), perinuclear spindle (B), mitotic spindle (C) and phragmoplast (D). Different mitotic arrays disorders (arrows) under Cd stress (E–H). Bar = 10 μm.

