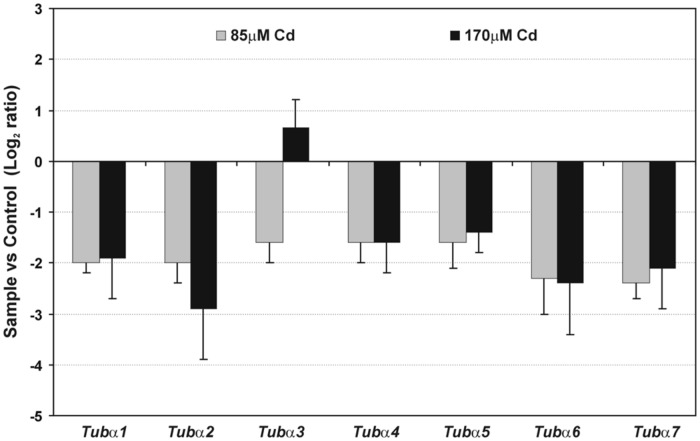
FIGURE 4.
Relative expression of gene encoding α-tubulin isotypes. Fold change evaluated through real time PCR after moderate (85 μM Cd) and high (170 μM Cd) metal treatment. Values shown in the histogram are represented as a log2 fold change compared to the control sample average of 0 (untreated seedlings). The results represent the mean (+SE) of three separate experiments.

