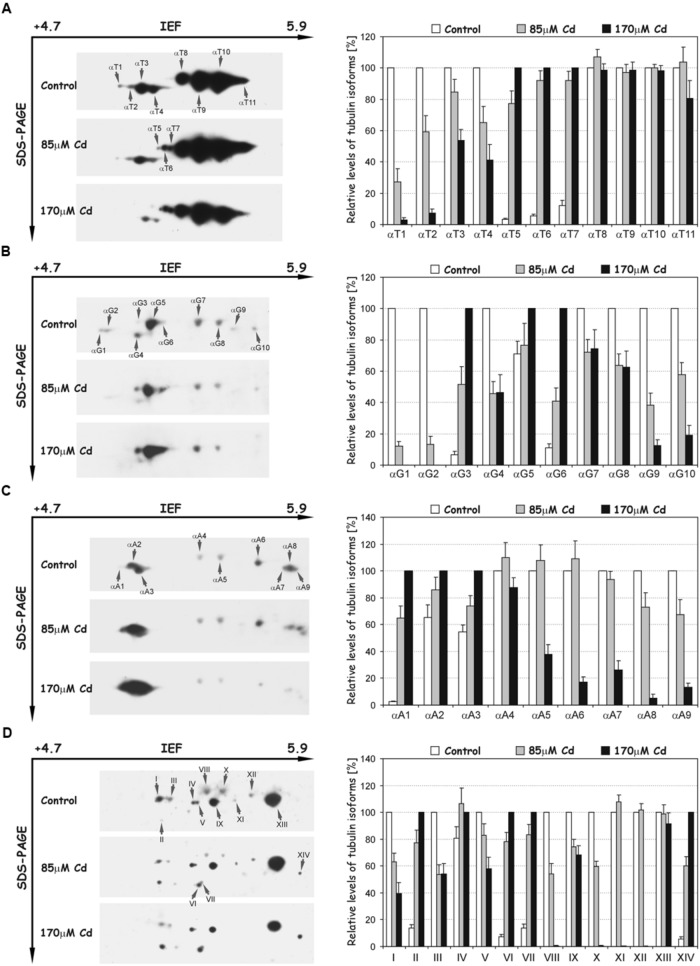
FIGURE 6.
Representative immunoblots probed with a set of different antibodies against tyrosinated α-tubulin (A), detyrosinated α-tubulin (B), acetylated α-tubulin (C) and polyglutamylated proteins (D). Individual tubulin isoforms (spots) are denoted by arrows marked: αT1–αT11 (tyrosinated isoforms), αG1–αG10 (detyrosinated isoforms), αA1–αA9 (acetylated isoforms) and I–XIV (polyglutamylated proteins). The quantitative results were calculated as a ratio of pixel intensity values to the area of spots, and the data were presented considering the control or 170 μM Cd as a reference point (100%). Values represent the average of three independent measurements with a standard deviation.

