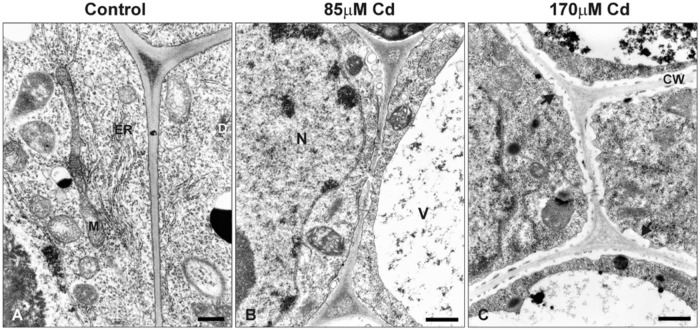
FIGURE 7.
Electron micrographs of the root tip cells of control seedlings (A) and plants treated with moderate (B) or high (C) Cd concentrations (85 or 170 μM Cd, respectively). M, mitochondrion; N, nucleus; V, vacuole; ER, endoplasmic reticulum; D, dictyosome; CW, cell wall. Black arrows indicate irregular deposition of callose in the root cells of Cd-treated seedlings. Bar = 500 nm.

