
Figure 2.
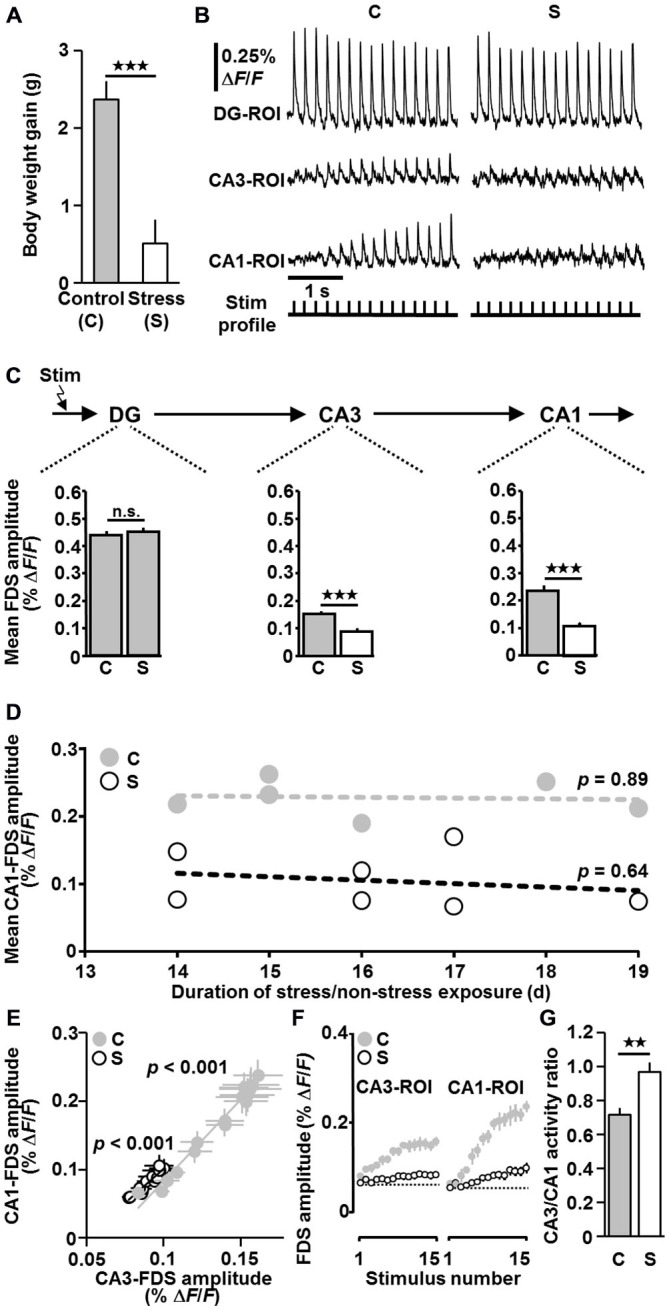
Exposure of mice to chronic social defeat stress causes markedly weakened HTC-Waves. (A) Data from body weight measurements (body weight gain during stress/non-stress exposure; stress (n = 7) vs. control (n = 6): t(11) = −4.6, p < 0.001; two-tailed unpaired t-test). (B) Representative VSDI recording traces for control and stress conditions. For both recording sequences, the intensity of perforant path stimulation (15 pulses at 5 Hz) was adjusted such that the first DG-FDS had an amplitude of 0.45% ΔF/F. (C) Quantification of VSDI measurements (n = 6 animals/18 slices for the control group and n = 7 animals/19 slices for the stress group; VSDI measures obtained from 2–3 slices per animal were averaged, leading to n values of 6 and 7 for the control and stress group, respectively; stress vs. control: CA3: t(11) = −5.0, p < 0.001; CA1: t(11) = −5.7, p < 0.001; two-tailed unpaired t-tests). For a detailed description of how the measure “Mean FDS amplitude” was calculated see “Materials and Methods”. (D) Relationships between mean CA1-FDS amplitude and duration of stress/non-stress exposure (p values were determined by linear regression analyses). (E) In slices from both control and stressed mice, the amplitude of CA1-FDSs linearly increased with the amplitude of CA3-FDSs. Data were obtained by averaging the CA1- and CA3-FDS amplitude values for electrical stimulus 1, 2, 3, …, 15 over the 18/19 experiments performed in control/stressed mice, in which the amplitude of the first DG-FDS was adjusted to ~0.45% ΔF/F. (F) The typical increase in CA3- and CA1-FDSs during 5 Hz perforant path stimulation is much weaker in slices from stressed animals. (G) CA3/CA1 activity ratios for the experiments conducted in control/stressed mice, in which the amplitude of the first DG-FDS was adjusted to 0.45% ΔF/F (stress vs. control: t(11) = 3.5, p = 0.005; two-tailed unpaired t-test). **p < 0.01, ***p < 0.001; n.s., not statistically significant.