Figure 13.
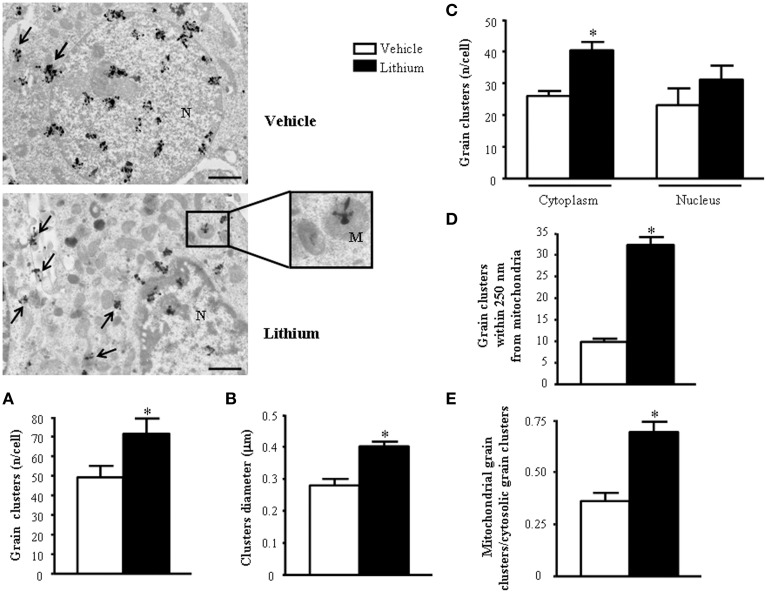
Representative TEM autoradiographs on distribution of [2-3H]adenine. TEM autoradiographs of PC12 cells exposed to [2-3H]adenine for 2 h. Grain clusters of [2-3H]adenine are distributed within nucleus and cytoplasm (arrows) of both control and lithium-treated cells. In detail, following lithium administration grain clusters increase in number (A) and diameter (B) and polarize in the cytoplasm (closer to mitochondria [insert]) (C). To fully consider these data, the reader is suggested to go back to Figure 1, which demonstrates the significant compartmentalization of grain clusters in the cytosol. In detail, while the total number of grain clusters in the cells is slightly increased by lithium (A). Such an increase is more pronounced in the cytosol compared with nucleus (C) Within cytoplasm the number of clusters placed in 100 nm sided squares within or close to mitochondria up to a 250-nm distance from mitochondrial outer membrane, markedly increases after lithium exposure (D and Figure 1). In fact, in cells treated with lithium within 250 nm there is three-fold amount of grain clusters compared with vehicle treated cells. The ratio between mitochondrial grain clusters within 250 nm around mitochondria and cytoplasmic grain clusters significantly increases after lithium exposure (E). Values are the mean ± S.E.M. Comparisons between groups were made by using One-way ANOVA (C) and Student's t-test for unpaired data (A, B, D and E). *P ≤ 0.05 compared with control. Scale bars: (low magnification) = 1.1 μm; (insert) = 0.43 μm.

