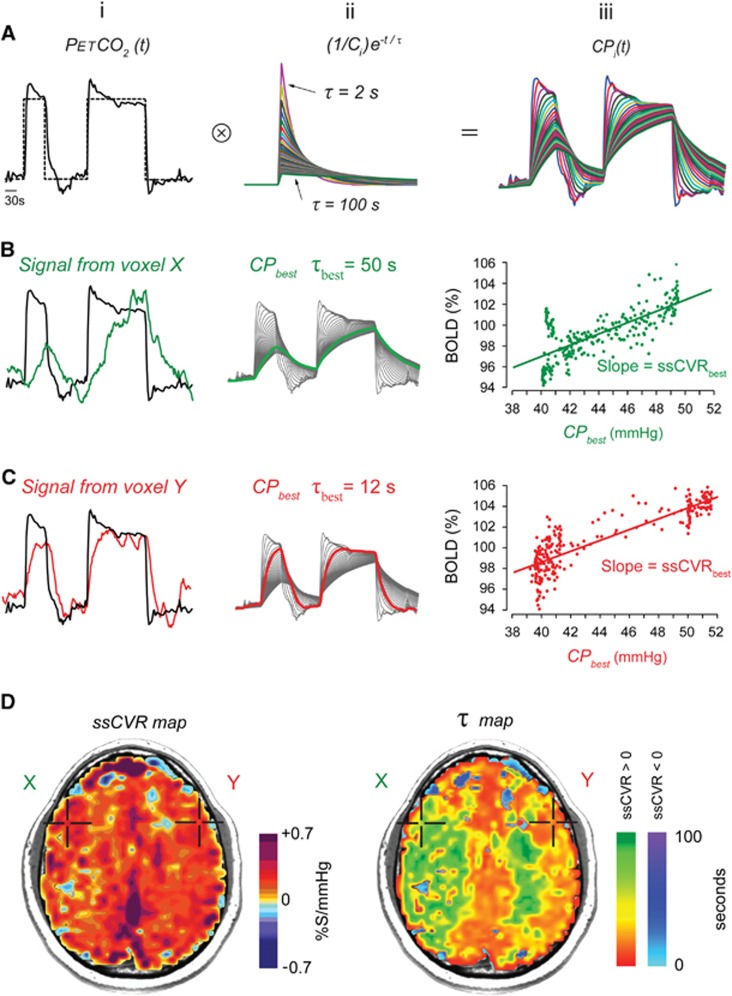
Figure 1.
Generation of steady-state cerebrovascular reactivity (ssCVR) and time constant (τ) maps from a standardized abrupt two-step stimulus. (A) (i) Target (dotted line) and actual (solid line) end-tidal partial pressure of CO2 (PETCO2). (ii) The set of first-order exponentials with τ ranging from 2 to 100 seconds used to convolve the actual PETCO2 to generate a set of convolved curves seen in (iii). (B and C) (i) Actual PETCO2 (solid black line) and blood oxygen level-dependent (BOLD) signal (green and red lines) from voxels X and Y, respectively, shown in (D). (ii) Set of curves resulting from the convolution of PETCO2. The highlighted line is that which has the best fit to the voxel BOLD signal shown in (i). (iii) The regression with the best fit between the convolved PETCO2 and the BOLD signal is shown. The difference in the pattern of the data results from the extent of distortion the convolution imposes on the PETCO2 input function. (D) The ssCVR map is generated from the slope of the line with the highest correlation coefficient as illustrated in the graphs in row (iii). The τ map is generated from the τ of the exponential used to generate the line with the highest correlation coefficient. The ssCVR and the τ values are color coded according to the color scales shown and mapped onto the corresponding voxels in the anatomic scan.

