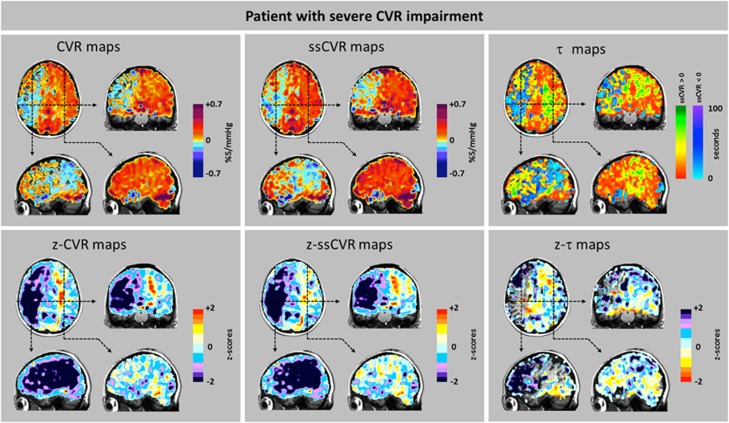
Figure 8.
Cerebrovascular reactivity (CVR), steady-state CVR (ssCVR), τ, and respective z maps from a patient (patient 10, Figure 4) showing severe changes. Scans from a 58-year-old male with a history of treated hypertension and lymphoma who presented for investigation of a new onset of recurrent transient left sided weakness. There were no neurologic deficits on clinical examination. Imaging showed that the right internal carotid artery was occluded above the origin by a calcified plaque. The left system was free of disease. The anterior and posterior communicating arteries were patent. Top row: CVR and ssCVR maps are nearly identical indicating the predominance of reductions in CVR over reductions in τ. The τ map requires different interpretations regarding the severity of underlying pathology in the areas with positive response (red-green color scale) and those with negative response (blue color scale). This is discussed in greater detail in Results section. Bottom row: The z maps show that reduced CVR is mostly due to reduced amplitude of response. Note that the z-τ map shows only voxels with positive τ.

