Figure 2.
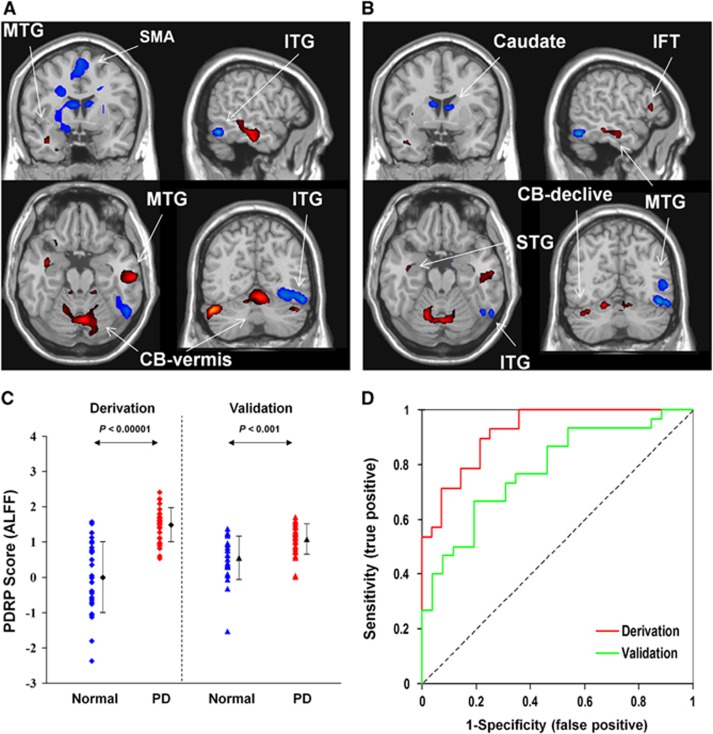
The comparison of Parkinson's disease–related spatial covariance pattern–amplitude of low-frequency fluctuation (PDRP–ALFF) brain networks and group discrimination in patients with PD and healthy controls in the split-sample analysis. (A) The pattern in the whole sample identified using ALFF images in cohort A was characterized by increased/decreased activity in the cortical and subcortical regions and reliable at P<0.025 (Table 1). (B) The pattern in the split sample was derived using ALFF images from 28 PD patients and 28 normal controls in cohort B (reliable at P<0.05) and validated prospectively in 30 PD patients and 26 normal controls in cohort C. (C) The expression of PDRP–ALFF from cohort B significantly discriminated the PD patients from the control subjects (P<0.001) in both the derivation and validation cohorts. (D) Receiver operating characteristic curves for discriminating the PD patients from the normal controls. The discriminatory power was lower in cohort B and cohort C than that in cohort A (see Figure 1C). Both covariance patterns are overlaid on a standard T1-weighted magnetic resonance imaging (MRI) brain template and displayed side by side with a height threshold of ±0.5 and an extent threshold of 30 voxels (240 mm3). Red/blue color indicates increased/decreased covariation in local spontaneous neural activity among a large number of brain regions present in the PDRP. Error bars represent the s.d. plotted around the mean of each subject group. CB, cerebellum; IFT, inferior frontal triangular parts; ITG, inferior temporal gyrus; MTG, middle temporal gyrus; SMA, supplementary motor area; STG, superior temporal gyrus.

