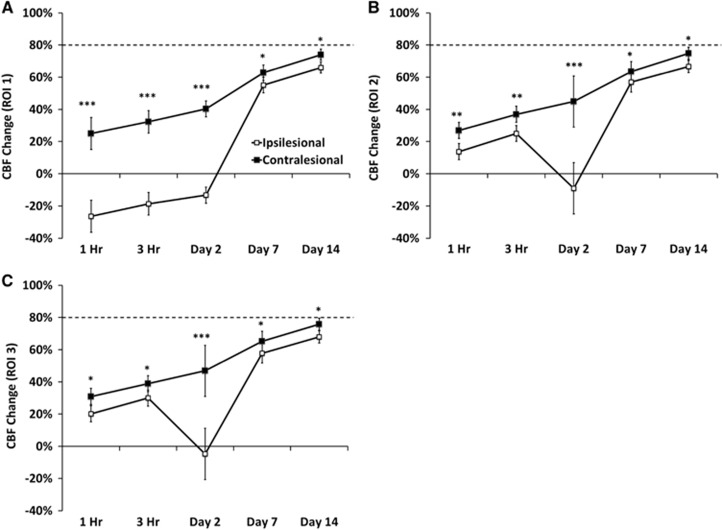
Figure 3.
Line graphs of the temporal progression of % cerebral blood flow changes responding to 5% CO2 challenge in the contralesional and ipsilesional cortices for (A) regions of interest 1, (B) regions of interest 2, and (C) regions of interest 3 (mean±s.e.m., n=8, * P<0.05, **P<0.01, *** P<0.001 between ipsilesional and contralesional sides).

