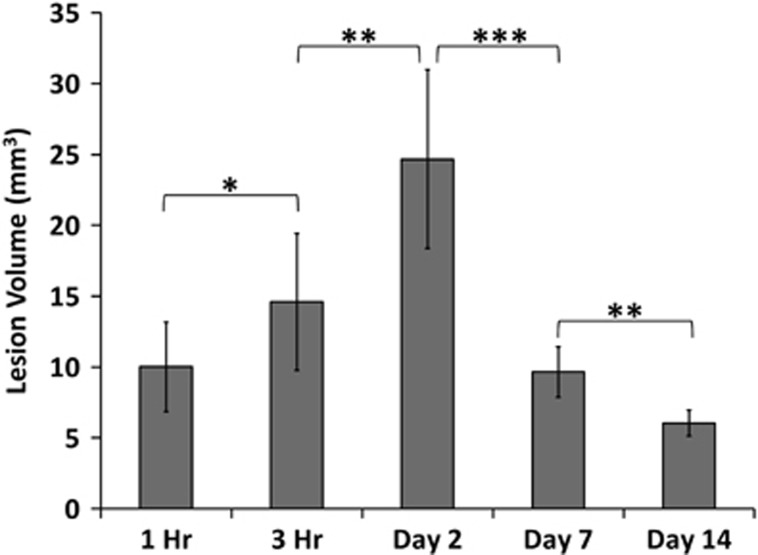
Figure 4.
Bar graph of lesion volumes defined by T2 abnormality at 1 hour, 3 hours, 2, 7, and 14 days post traumatic brain injury (mean±s.e.m., n=8, * P<0.05, ** P<0.01, *** P<0.001). Lesion volumes were determined as pixels that had T2 values higher than the mean plus 2 s.d. of the value in the homologous contralesional region.

