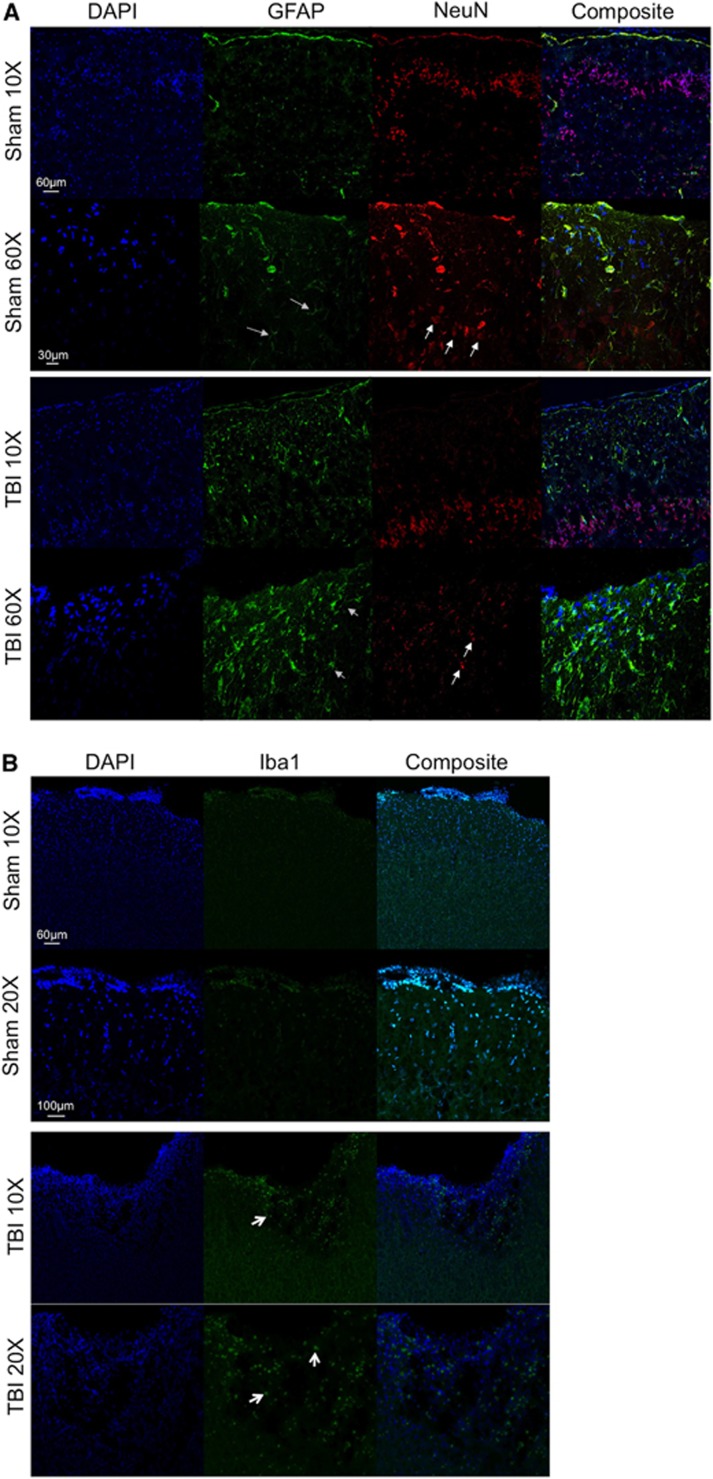
Figure 5.
(A) Representative images for both Sham and traumatic brain injury animals are shown at × 20 and × 60 for DAPI (blue), glial fibrillary acidic protein (green), neurons (red) and a composite image. White arrows indicate normal neuronal soma morphology in Sham animals and abnormal morphology in traumatic brain injury animals. Gray arrows indicate glial fibrillary acidic protein positive cells in both Sham and traumatic brain injured animals. (B) Representative images for Sham and traumatic brain injury animals are shown at × 10 and × 20 for DAPI (blue) and Iba1 (green) and a composite image for each group. White arrows indicate Iba1 positive cells in the traumatic brain injury animals.

