Figure 1.
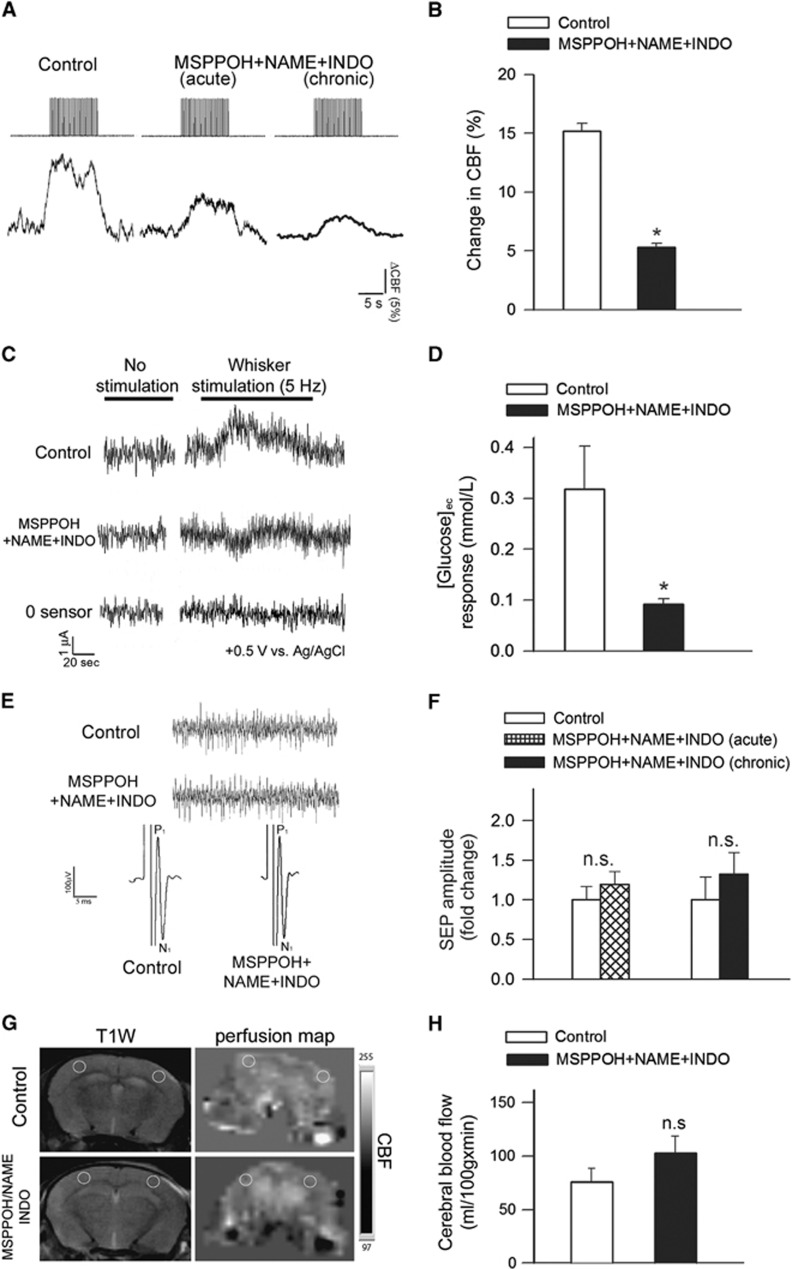
Experimentally induced neurovascular uncoupling in mice. (A) Representative traces of cerebral blood flow (CBF) measured with a laser Doppler probe above the whisker barrel cortex during electrical stimulation of the contralateral whisker pad (current: 0.2 mA, pulse duration: 0.3 ms, at 2 Hz for a 30-second period) before (left) and after (middle) topical administration of N-(methylsulfonyl)-2-(2-propynyloxy)-benzenehexanamide (MSPPOH), l-NG-Nitroarginine methyl ester (L-NAME) plus indomethacin (INDO; see Materials and methods) through the cranial window. Right: representative trace of CBF response obtained in a mouse treated chronically with MSPPOH, l-NAME plus INDO (see Materials and methods). (B) Bar graphs depict the summary data of the effect of MSPPOH+NAME+INDO treatment on CBF responses to whisker stimulation. Data are mean±s.e.m. (control: n=9, treated: n=6, *P<0.01 versus Control). (C) Original recordings of changes in extracellular glucose ([glucose]ec) in response to whisker stimulation (5 Hz, 2 minutes) measured by amperometry using a glucose biosensor inserted into the barrel cortex of mice treated with MSPPOH+NAME+INDO or vehicle. ‘0 sensor': signal obtained with a biosensor constructed the same way as the glucose sensors, without the enzymes necessary for biosensing. Summary data are shown in (D). In animals treated with MSPPOH+NAME+INDO the glucose response elicited by whisker stimulation was significantly decreased. Data are mean±s.e.m. (n=6 in each group, *P=0.002 versus Control). (E) Representative recordings showing the effect of treatment with MSPPOH+NAME+INDO on somatosensory evoked potential (SEP) responses in the primary somatosensory cortex in response to electrical stimulation of the contralateral whisker pad in control and treated groups. Amplitude peaks of SEP are labeled P1 and N1 to reflect their polarity and sequence. Inlet shows spontaneous cortical electric activity. (F) The amplitudes of the negative waves (N1) were unaffected by either acute administration of MSPPOH+NAME+INDO in the cranial window (n=6, P=0.2) or chronic treatment of the mice with MSPPOH+NAME+INDO (control: n=9, treated: n=6, P=0.4). (G) T1-weighted morphological MRI scans and the corresponding perfusion map in the brain of a control and a MSPPOH+NAME+INDO treated mouse are shown. The slice is located 1 to 1.5 mm posterior from bregma, the yellow circles show regions of interest (ROIs) placed on the barrel field where cerebral blood flow (CBF, mL/100 g min) measurements were taken. Summary data for basal perfusion (mean±s.d.; n=10 in each group) are shown in (H) (n.s.: P=0.139).

