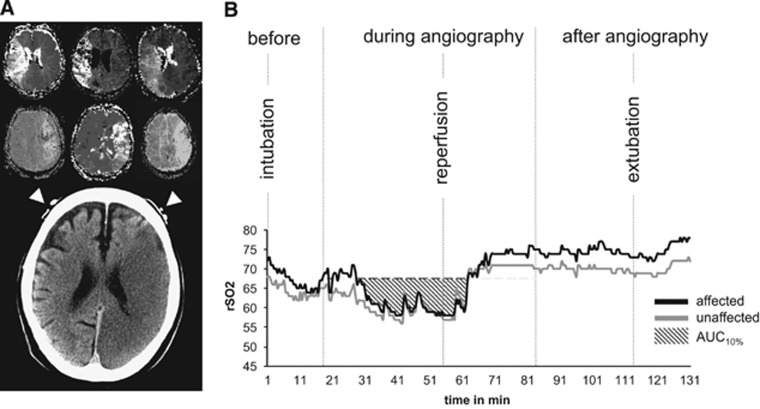
Figure 2.
(A) Illustration of NIRS optode positioning at the border zone of the two territories of the middle and anterior cerebral arteries; the upper part shows six individual examples of time-to-peak magnetic resonance perfusion maps; the lower part is taken from a follow-up computed tomography scan—white arrow heads indicate NIRS optode positions. (B) Individual curve of one patient demonstrating the NIRS monitoring workflow, in principle including the predefined events for analysis. AUC10%, area under the curve 10% below baseline; NIRS, near-infrared spectroscopy.

