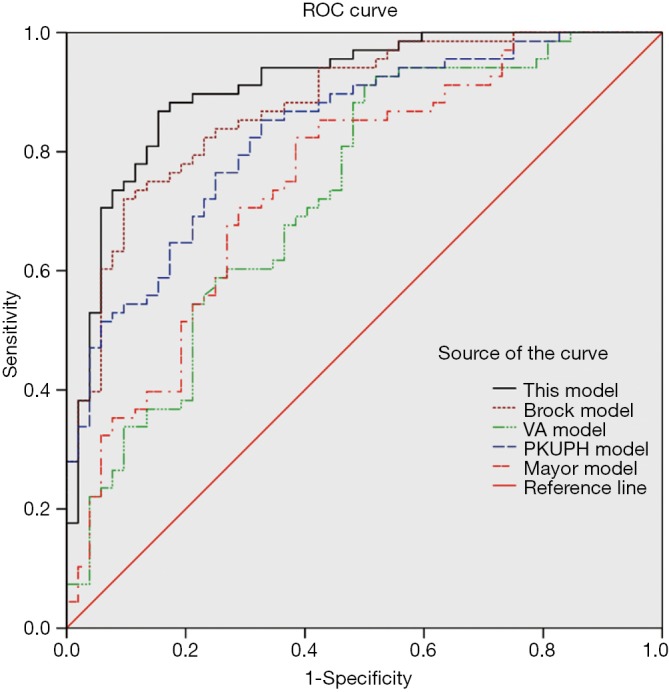
Figure 2.

ROC curve of our proposed model and other models. The area under ROC curve of our model is significantly higher than the Mayo model VA model and PKUPH model. Our model (AUC =0.910) compared with Brock model (AUC =0.878, P=0.350). ROC, receiver operating characteristic; AUC, area under the curve; PKUPH, Peking University People’s.
