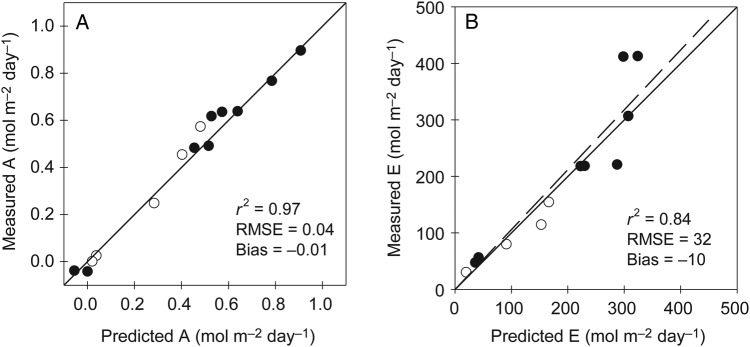
Figure 5.
Comparison of measured and predicted values of daily net photosynthesis (A) and transpiration rates (B). Dashed lines: regressions between measured and predicted values; solid lines: 1 : 1 relationships. Open and filled symbols indicate leaves from canopies grown with N− and N+ nutrient solutions, respectively.

