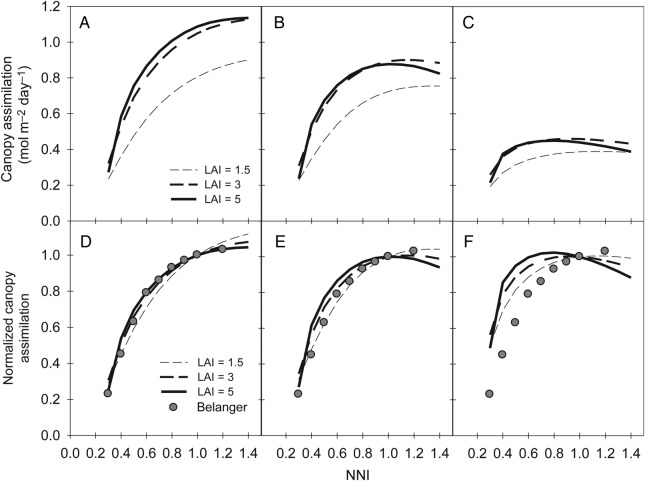
Figure 6.
Simulations for three contrasting days of whole-canopy net assimilation in response to changes in the canopy NNI and LAI (A–C) and their corresponding responses normalized by the assimilation rate at an NNI value of 1 (D–F). Grey circles in the lower panels represent the relative reduction in radiation use efficiency measured by Bélanger et al. (1992) in response to NNI.

