Figure 4.
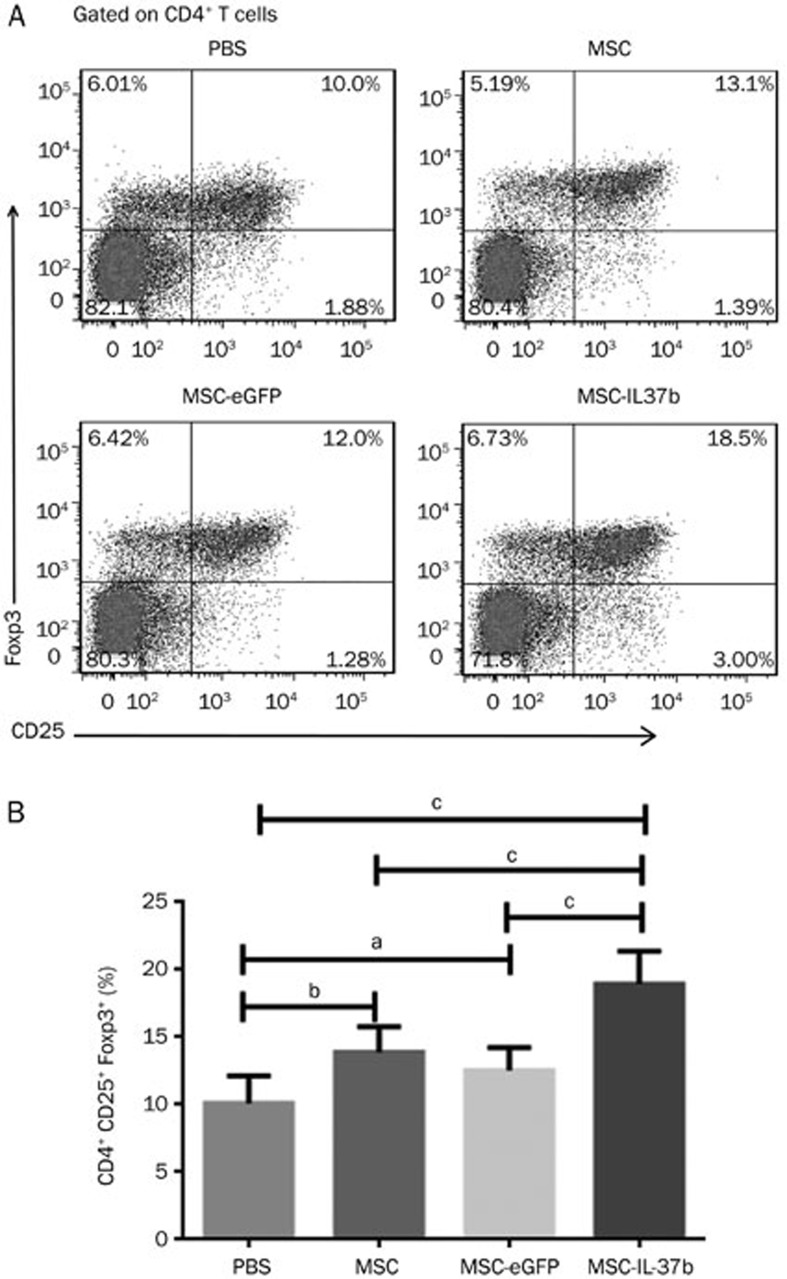
Treatment with MSCs, MSC-eGFP, or MSC-IL-37b induced splenic Tregs in mice with DSS-induced colitis. On d 10 after DSS administration, mice in each group were euthanized for analysis of splenic Tregs. Splenic cells were analyzed for CD4, CD8, and CD25 surface marker expression and Foxp3 intracellular expression by flow cytometry. (A) Dot plots of Tregs. (B) Summarized results of the percentages of Tregs. The data are presented as the mean±SEM (n=6 mice per group). aP>0.05, bP<0.05, cP<0.01. The data are representative of three independent experiments.

