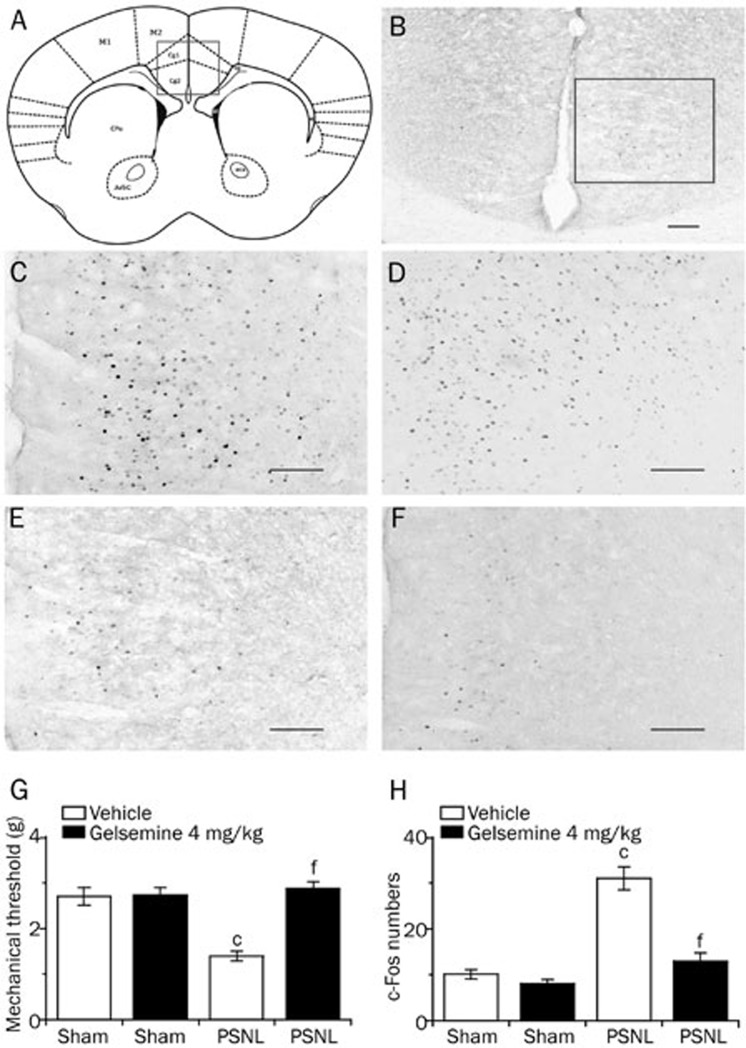
Figure 8.
Effects of gelsemine on c-Fos expression in the ACC of PSNL and sham mice. (A and B) The site of the ACC was verified according to the coordinates provided by Franklin and Paxinos shown on the left. (C–F) Representative photomicrographs of c-Fos expression in the ACC of the PSNL+4 mg/kg gelsemine group (C), the PSNL+vehicle group (D), the sham+4 mg/kg gelsemine group (E), and the sham+vehicle group (F); scale bars=100 μm. (G) Mechanical allodynia was measured 90 min after treatment with vehicle or gelsemine in PSNL and sham mice. (H) Number of c-Fos-expressing cells in the ACC of PSNL and sham mice 120 min after treatment with vehicle or gelsemine. Data are expressed as mean±SEM (n=8). cP<0.01 vs vehicle-treated sham mice; fP<0.01 vs vehicle-treated PSNL mice.

