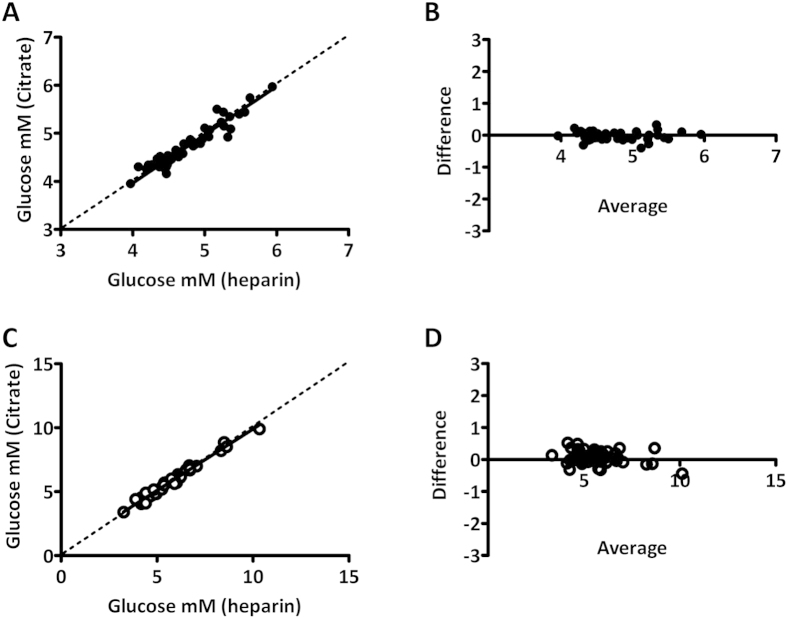
Figure 3. Comparison between STAT and feasible laboratory glucose measurements.
(A,C) Deming regression plots for t = 0 and t = 120 minutes and B,D) Bland-Altman plots for glucose concentration for t = 0 and t = 120 minutes. Plots depict difference in glucose concentration (citrate minus heparin) as a function of the average glucose concentration (citrate and heparin).

