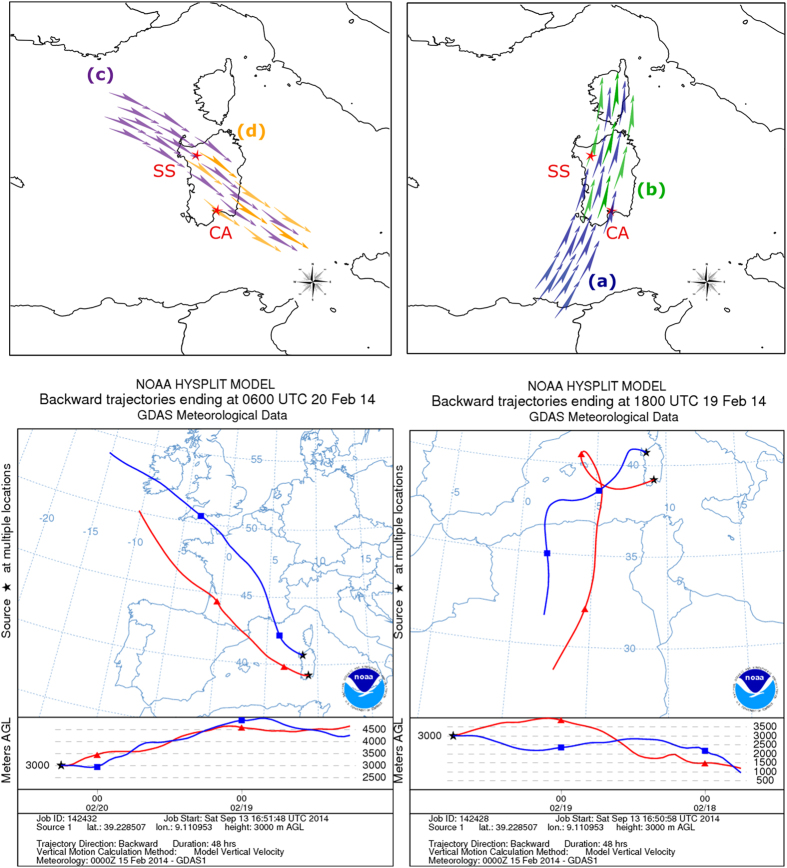
Figure 1. Reconstruction of the wind flows crossing the two sites during the sampling dates.
Top left panel: control conditions event with winds blowing from northwest to south-east, Top right panel: African dust-carrying event with northbound winds. Bottom panels: corresponding particle back-trajectories simulations evaluated by the HYSPLIT model for the two sampling days. SS: Sassari sampling point; CA: Cagliari sampling point. Letters and colored arrows in the two top panels indicate four theoretically distinct pools of putatively airborne bacteria: (a) from Africa and Mediterranean sea (blue arrows); (b) the same plus those raised from inland Sardinia in northbound wind motion from Cagliari to Sassari (green arrows); (c) from continental Europe and Tyrrhenian sea (violet arrows); (d) the same plus those raised from inland Sardinia in southbound wind motion from Sassari to Cagliari (orange arrows). Source of images: top panels: this work; bottom panels: output of the public website service software HYSPLIT (http://ready.arl.noaa.gov/HYSPLIT.php).

