
Figure 2. Percentages of sequences assignable to database-identifiable bacterial in each of the two sampling sites at each event (Control or Dust).
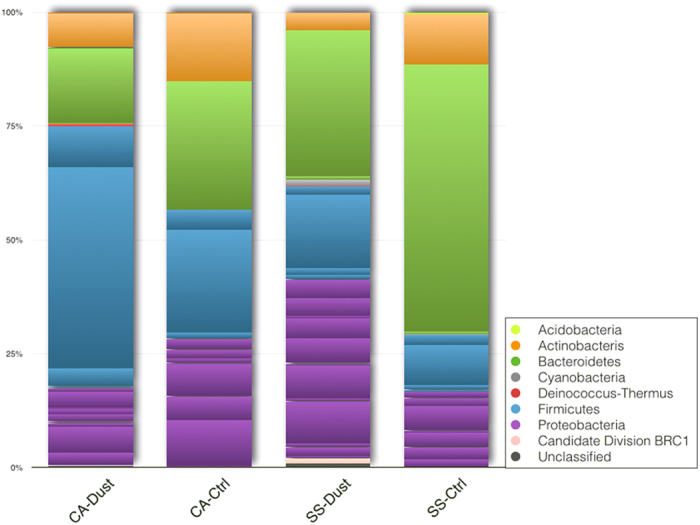
CA: Cagliari sampling site, SS: Sassari sampling site. The slices within each phylum block of the same color indicate the number of orders found within that phylum.