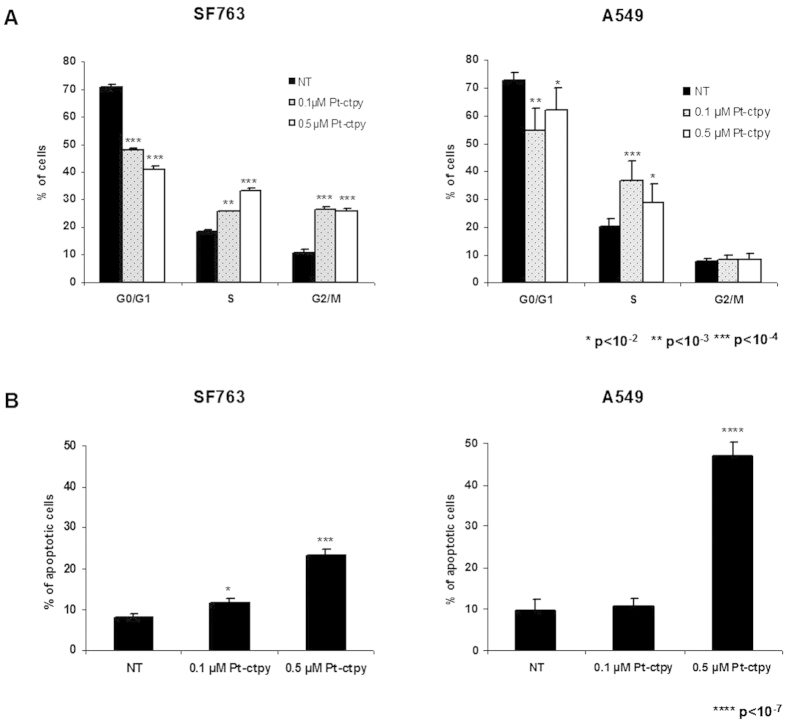
Figure 2. Effects of Pt-ctpy on cell cycle and apoptosis.
(A) Cell cycle analysis: distribution of cells in the different cell cycle phases. SF763 and A549 cells exposed to Pt-ctpy showed significant modifications in this distribution. (B) Flow cytometry assessment of sub-G0/G1 fraction, corresponding to apoptotic cells. Tumor cells treated with Pt-ctpy exhibited a significant increase in Sub-G0/G1 population (t-test).

