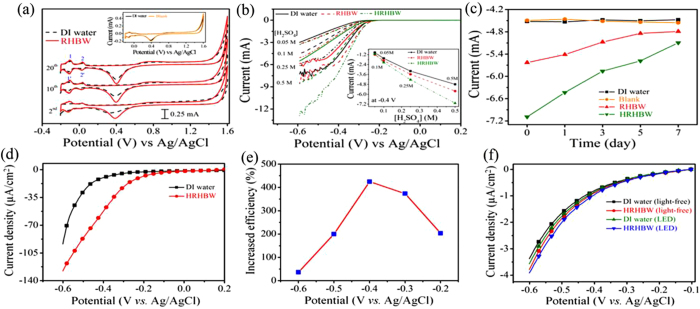
Figure 3. Voltammetric data for hydrogen evolution in various types of water with H2SO4 as the supporting electrolyte and a planar Pt electrode.
(a) Cyclic voltammograms of the second, 10th and 20th scans in 0.5 M H2SO4 at a scan rate of 0.5 V s−1; the insert shows the 10th scans for experiments performed on DI water and the blank (light-free) for comparison. (b) Linear sweep voltammograms (LSVs) in different concentrations of H2SO4 at a scan rate of 0.05 V s−1; the insert shows the hydrogen evolution currents at −0.4 V vs Ag/AgCl in various waters with different concentrations of H2SO4. (c) Currents of hydrogen evolution at −0.4 V vs Ag/AgCl in various types of water, after its preparation for 0, 1, 3, 5, and 7 days (in 0.5 M H2SO4 at a scan rate of 0.05 V s−1). Hydrogen evolution reaction performed at an inert-catalytic electrode (ITO) and photocatalytic (g-C3N4/ITO) electrodes. (d) LSVs for hydrogen evolution in DI water and HRHBW containing 0.5 M H2SO4 based on the ITO electrode. (e) The increased efficiency of HER based on HRHBW with the applied potential shown in Fig. 3d. (f) LSV for hydrogen evolution reactions performed in DI water and HRHBW containing 0.5 M Na2SO4 based on g-C3N4/ITO electrode with and without illumination of white-light LED.

