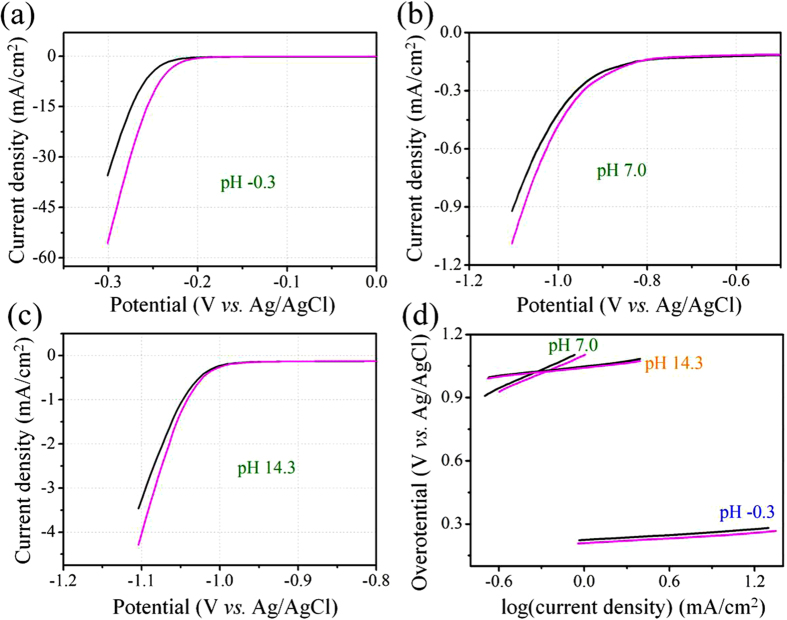
Figure 4. Hydrogen evolution reactions performed at inert-catalytic electrode (ITO) in electrolyte with various pH values.
LSV curves recorded on Pt electrode in (a) 1 M H2SO4 (pH −0.3), (b) 0.2 M KCl (pH 7), and (c) 2 M KOH (pH 14.3). (d) The corresponding Tafel plots at pH values of 0.3, 7.0 and 14.3. Black line: electrolyte solution based on DI water. Pink line: electrolyte solution based on HRHBW water.

