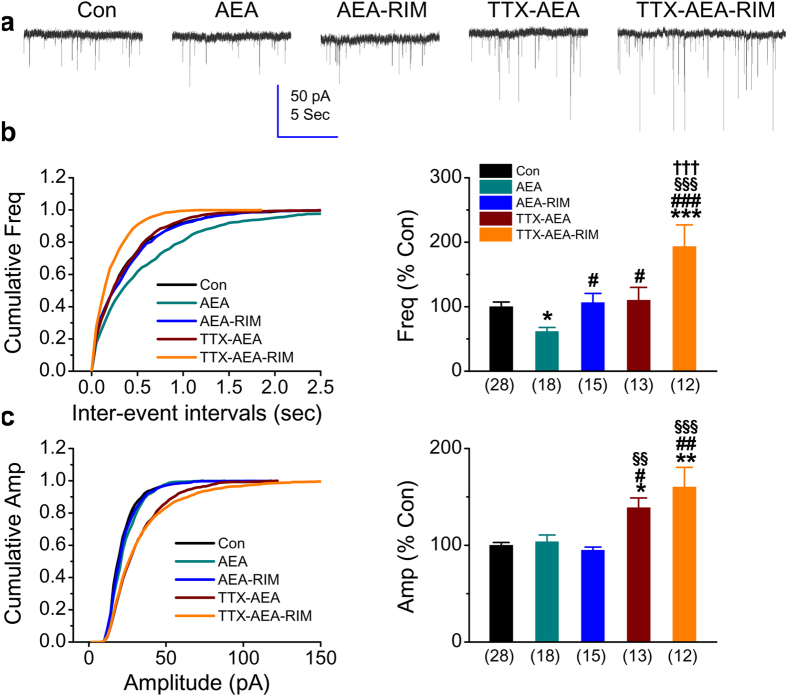
Figure 6. CB1 receptor mediates AEA-induced suppression of the frequency of mEPSCs.
(a) Representative recording traces of mEPSCs under various treatments. TTX (1 μM) and Rimonabant (RIM, 1 μM) was added to cultures for two days. Anandamide (AEA, 5 μM) was treated in culture once a day for two days. (b) Cumulative probability of mEPSC frequency recorded in neurons with different treatments (left) and mean percentage of changes in the frequency of mEPSCs in neurons with different treatments (right). (c) Cumulative probability of mEPSC amplitude recorded in neurons with different treatments (left) and mean percentage of changes in the amplitude of mEPSCs in neurons with different treatments (right). Data are mean ± SEM. *p < 0.05, **p < 0.01, ***p < 0.001, compared with the control; #p < 0.05, ##p < 0.01, ###p < 0.001, compared with AEA; §§p < 0.01, §§§p < 0.001, compared with AEA + RIM; †††p < 0.001, compared with TTX + AEA (ANOVA with Dunn’s post hoc test).

