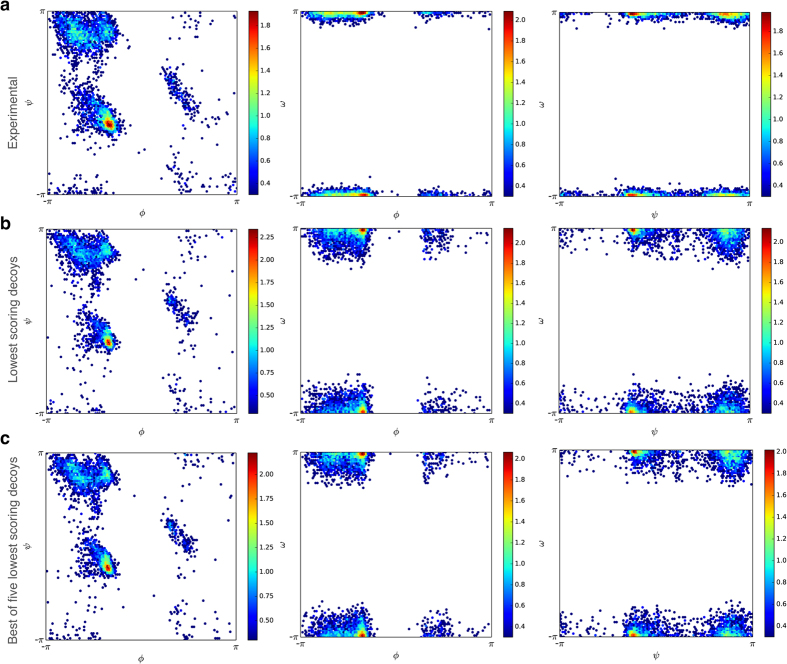
Figure 2. Distributions of dihedral angles ϕ, ψ, and ω.
The joint histograms of (ϕ, ψ), (ϕ, ω), and (ψ, ω) are shown for experimental structures (a), FUSION-generated decoys with lowest DFIRE score (b) and decoys closest to their corresponding experimental structures among the five lowest scoring decoys (c), with color code ramping from blue to red for low to high density.

