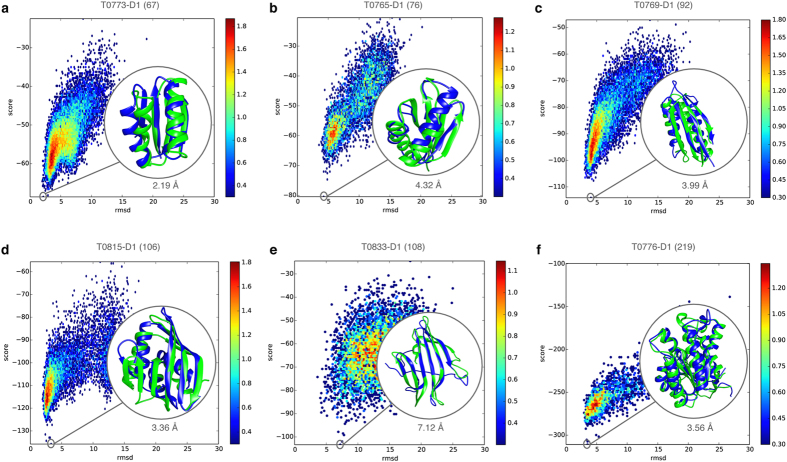
Figure 3. Energy landscapes of FUSION simulations for diverse protein targets.
(a–f) Energy (DFIRE score) verses accuracy (Cα-rmsd) for decoys produced by FUSION for protein targets T0773-D1 (a), T0765-D1 (b), T0769-D1 (c), T0815-D1 (d), T0833-D1 (e) and T0776-D1 (f), with color coding from blue to red for low to high density and a measure for the underlying energy scale. The lowest scoring decoys (in blue) overlaid on the experimental structures (in green) are highlighted in the insets, with their accuracies (Cα-rmsd) quantified below. In each case, protein length is indicated within parentheses next to the target name.

