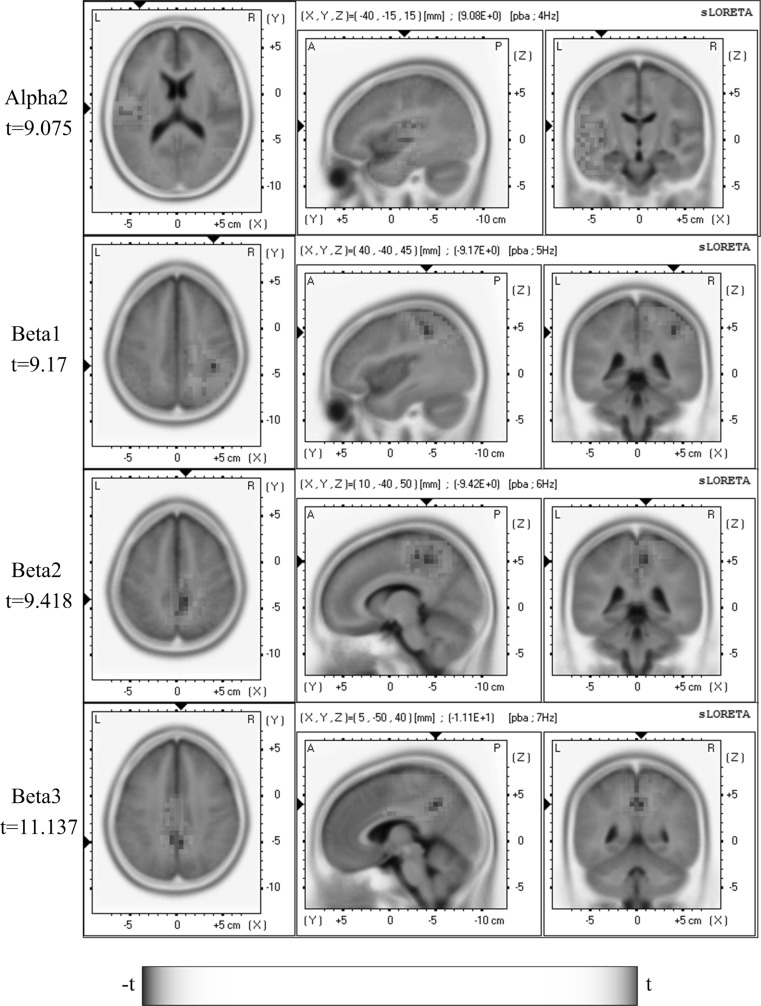
Fig. 2.
Comparison of sLORETA activation between Pre-Moxi and Moxi sessions revealed significant changes in alpha2, beta1, beta2 and beta3 bands during moxibustion (blue for decrease and red for increase). Images were color-coded non-parametric statistical maps. Increased activities in the alpha2 band were observed in the insula, whereas reduced activities occurred in the beta1 band in right parietal and cingulate gyrus, in the beta2 band in bilateral parietal, medial/right frontal regions and cingulate gyrus, and in the beta3 band in bilateral frontal/parietal and cingulate gyrus. A scale bar indicated statistical power and color scale linearity equalled to 75. The location of the maximal t value was graphically indicated by black triangles on the coordinate axes. (Color figure online)

