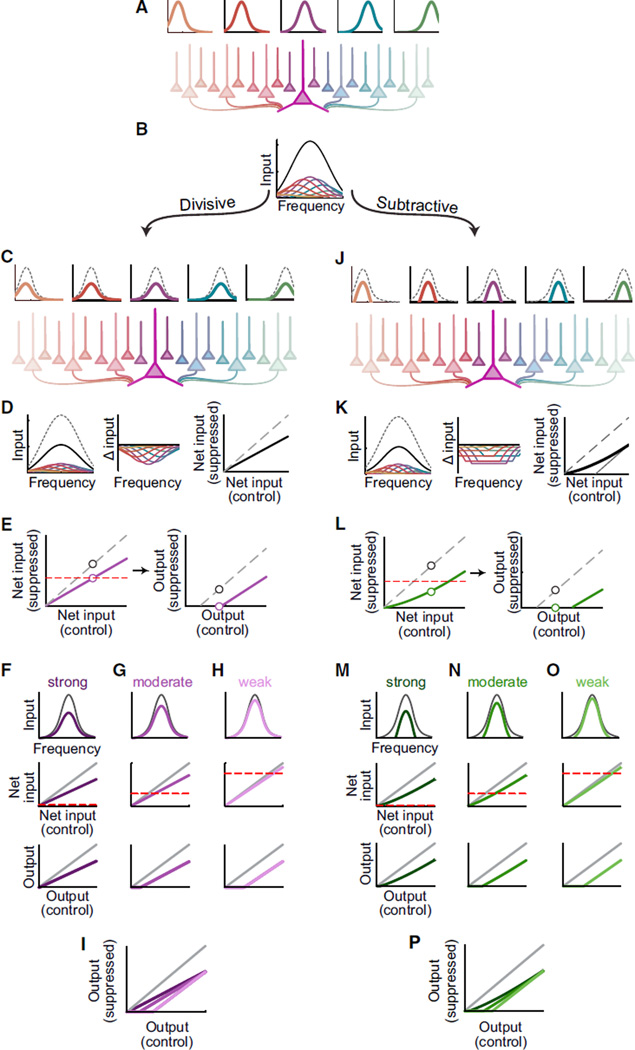
Figure 8. Linear Suppression Types May Be Obscured by Network Properties.
(A) Neurons tuned to different frequencies (top) are connected to a downstream neuron (large purple neuron in the center) by a connectivity function that weakens with distance (shading).
(B) The contributions of many tuned input neurons (colors) are summed by the downstream neuron, producing a center-peaked tuning curve (black).
(C) Schematic similar to (A) in which input neurons are divisively suppressed (dashed versus color).
(D) Left: sum (black) of individually suppressed inputs (color) is divisively suppressed compared to control (dashed). Center: decreases in contributions from each input (color) as a function of frequency. Right: input strength comparison for divisively suppressed inputs (black) versus control (dashed).
(E) Divisive suppression (purple, left) can appear subtractive (right) when spiking threshold (dashed red) limits observable output.
(F–I) Variations in suppression strength and threshold can cause divisive suppression of inputs to produce primarily divisive (F), subtractive (H), or mixed (G) suppression of the spiking output (overlaid in I).
(J–P) Similar to (C)–(I) but for subtractive suppression. Note that because firing rates cannot be negative, subtractively suppressed inputs are not uniformly suppressed (H, center). As a result (H, right), the sum of subtractively suppressed inputs (thick black) differs from theoretical subtractive suppression (thin gray).

