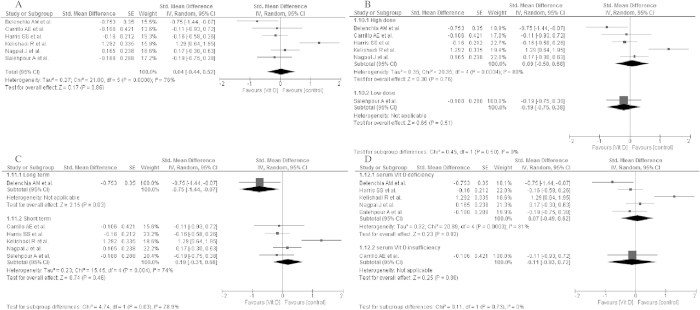
Figure 4.
Forest plot of the random-effects meta-analysis of changes in HOMA-IR according to (A). Overall effect (B). The dose of vitamin D supplementation (C). Time of vitamin D supplementation and (D). Baseline of 25(OH)D concentration shown as polled standard differences in means with 95% CI by standard differences in means of glucose concentrations in selected randomised trials. *For each study, the square represents the point estimate of the intervention effect. Horizontal lines join the lower and upper limits of the 95% CI of this effect. The area of shaded squares reflects the relative weight of the study in the meta-analysis. Diamonds represent the subgroup mean difference and pooled mean differences. CI indicates confidence interval. Low dose: 125–2000 IU/day; high dose: 3571–4000 IU/d, deficiency : <50 nmol/l, insufficiency:52.5–72.5 nmol/l, short: until 15-weeks, long: >15weeks.

