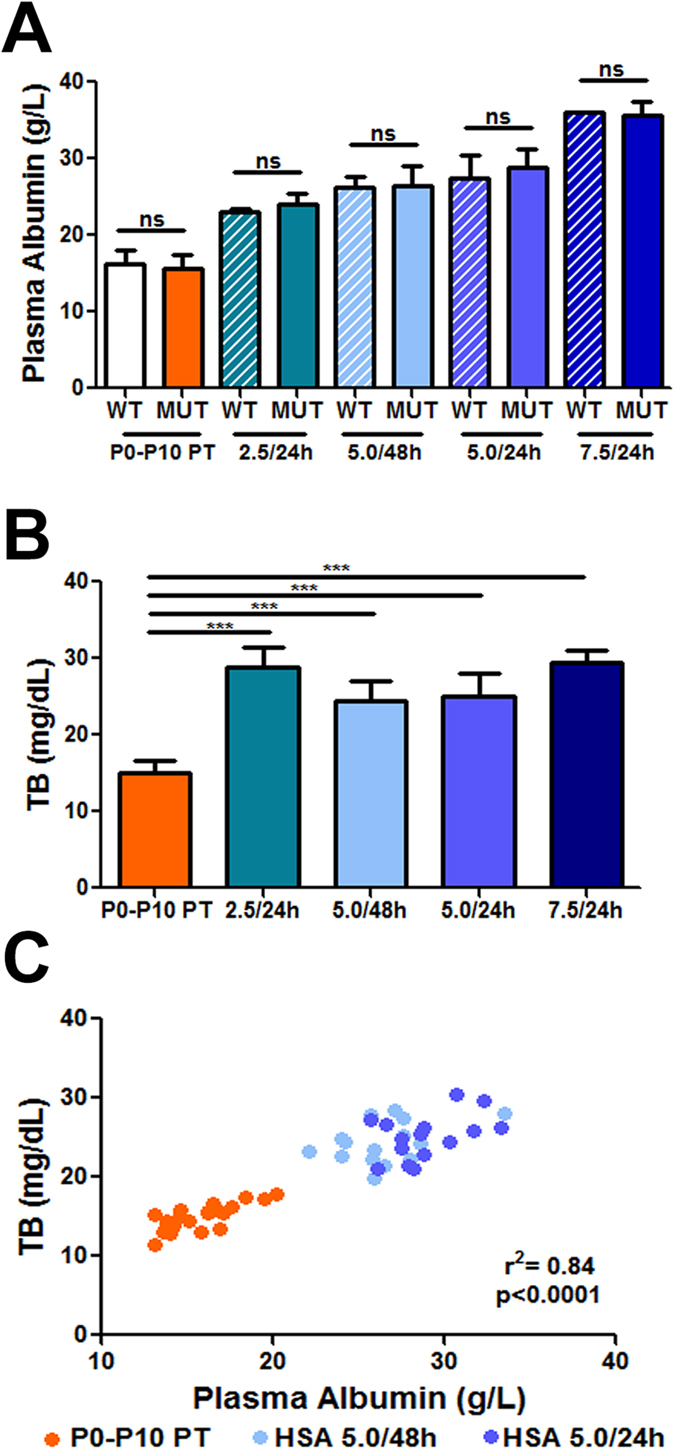
Figure 2. Dose-dependent effect of albumin administration on plasma values.

(A) Plasma albumin levels in untreated and HSA injected mutant and WT mice at P15. Values represent mean ± SD (g/L). t-test, not significant. P0-P10 PT (WT = 20, MUT = 20), HSA 2.5 g/kg/24 h (WT = 5, MUT = 7), HSA 5.0 g/kg/48 h (WT = 4, MUT = 15), HSA 5.0 g/kg/24 h (WT = 5, MUT = 15), HSA 7.5 g/kg/24 h (WT = 1, MUT = 3); (B) Total plasma bilirubin levels in mutant mice at P15. Values represent mean ± SD (mg/dL). One-way ANOVA test, ***p < 0.001. P0-P10 PT (n = 20), HSA 2.5 g/kg/24 h (n = 7), HSA 5.0 g/kg/48 h (n = 15), HSA 5.0 g/kg/24 h (n = 15), HSA 7.5 g/kg/24 h (n = 3); (C) Correlation test between plasma albumin and total bilirubin (TB) in P0-P10 PT, HSA 5.0 g/kg/48 h and HSA 5.0 g/kg/24 h-treated mutant mice. Each dot corresponds to a single animal. Correlation test, Pearson coefficient WT, wild-type; MUT, mutant; HSA, human serum albumin; PT, phototherapy; P, post-natal day; TB, total bilirubin; ns, not significative.
