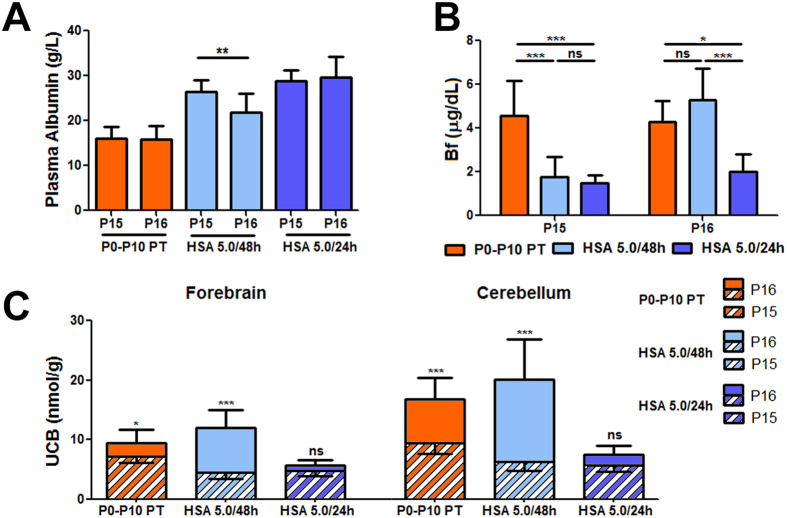
Figure 5. Plasma albumin, Bf and brain UCB at P16.
Increment of Bf and tissue UCB in the HSA 5.0/48 h group 48 h after the last albumin administration. Comparison between P15 and P16 in P0-P10 PT, HSA 5.0 g/kg/48 h and HSA 5.0 g/kg/24 h-treated mutant mice. (A) Plasma albumin levels decrease in HSA 5.0 g/kg/48 h treated mutant mice. Values represent mean ± SD (g/L). t-test, *p < 0.05. P0-P10 PT (n = 6), HSA 5.0 g/kg/48 h (n = 14), HSA 5.0 g/kg/24 h (n = 7); (B) Bf plasma levels at P15 and P16. Values represent mean ± SD (μg/dL). One-way ANOVA test, *p < 0.05, ***p < 0.001. P0-P10 PT (n = 6), HSA 5.0 g/kg/48 h (n = 7), HSA 5.0 g/kg/24 h (n = 7); (C) Brain UCB content. The stripped bars represent the amount of UCB at P15, while the full colored bars represent the increment of UCB levels from P15 to P16 (the whole bars, stripped plus full colored, represent UCB levels at P16). t-test, *p < 0.05, ***p < 0.001. P0-P10 PT (n = 6), HSA 5.0 g/kg/48 h (n = 8), HSA 5.0 g/kg/24 h (n = 6). The number of animals analyzed at P15 is indicated in the legend to Figs 2 and 3 HSA, human serum albumin; PT, phototherapy; P, post-natal day; Bf, free bilirubin; ns, not significative.

