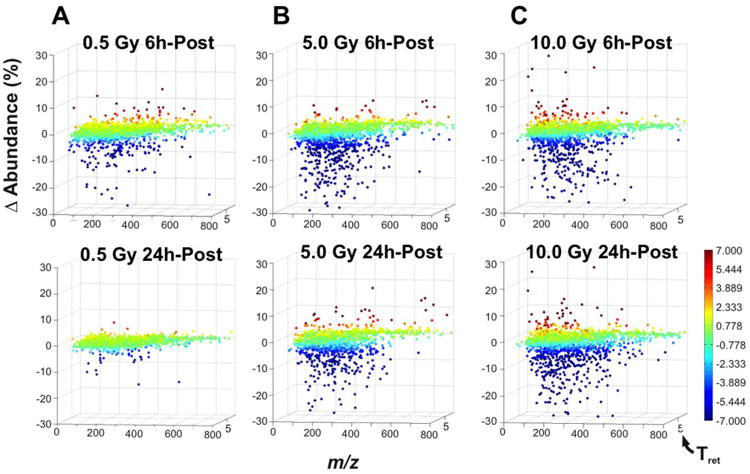
Figure 3.

Comparing the 6 h and the 24 h post-exposure data for the (A) 0.5 Gy, (B) 5.0 Gy, and (C) 10 Gy doses via VAMP reveals a strong global down-regulation response at the 6 h time point that seems transient at 0.5 Gy, but generally maintained at the 5.0 and 10 Gy doses. Each plotted point in a graph represents an ion, which is defined by its m/z (X-axis), retention time (Y-axis), and the abundance percentage change after irradiation (Z-axis). Each ion is colorized according to the abundance percentage change, with up regulation represented by the red end of the spectrum, and the down regulation by the blue end. While this transience is clear at 0.5 Gy, even at the 5.0 Gy dose, the percentage (67.38% out of 1119 plotted ions) and magnitude (-392.89%) of down regulation at 24 h seems slightly attenuated when compared to the 6 h time point (76.90% of 1385 plotted ions, -422.19% down-regulation).
